Represents a collection of points, lines and polygons with convenience methods for common drawing and filtering operations.
Args:
- crs - the coordinate reference system of this Feature
See also
To add features to the current matplotlib axes, see GeoAxes.
Specific Feature subclasses have been defined for common functionality, such as accessing Natural Earth or GSHHS shapefiles.
A class capable of drawing a collection of shapely geometries.
Args:
A collection of shapely geometries.
The cartopy CRS in which the provided geometries are defined.
A simple interface to Natural Earth shapefiles.
See http://www.naturalearthdata.com/
Args:
The category of the dataset, i.e. either ‘cultural’ or ‘physical’.
The name of the dataset, e.g. ‘admin_0_boundary_lines_land’.
The dataset scale, i.e. one of ‘10m’, ‘50m’, or ‘110m’. Corresponding to 1:10,000,000, 1:50,000,000, and 1:110,000,000 respectively.
An interface to the GSHHS dataset.
See http://www.ngdc.noaa.gov/mgg/shorelines/gshhs.html
Args:
The dataset scale. One of ‘auto’, ‘coarse’, ‘low’, ‘intermediate’, ‘high, or ‘full’ (default is ‘auto’).
A list of integers 1-4 corresponding to the desired GSHHS feature levels to draw (default is [1] which corresponds to coastlines).
To simplify some very common cases, some pre-defined Features exist as cartopy.feature constants. The pre-defined Features are all small-scale (1:110m) Natural Earth datasets, and can be added with methods such as GeoAxes.add_feature:
| Name | Description |
|---|---|
|
Country boundaries. |
|
Coastline, including major islands. |
|
Natural and artificial lakes. |
|
Land polygons, including major islands. |
|
Ocean polygons. |
|
Single-line drainages, including lake centerlines. |
Note
Any Natural Earth dataset can easily be used by creating an instance of cartopy.feature.NaturalEarthFeature. For example:
import cartopy.feature as cfeature
land_50m = cfeature.NaturalEarthFeature('physical', 'land', '50m',
                                        edgecolor='face',
                                        facecolor=cfeature.COLORS['land'])
A dictionary of some useful colors for drawing features also exists:
A dictionary of colors useful for drawing Features.
The named keys in this dictionary represent the “type” of feature being plotted.
For a full list of names in this dictionary:
>>> import cartopy.feature
>>> sorted(cartopy.feature.COLORS.keys())
['land', 'land_alt1', 'water']
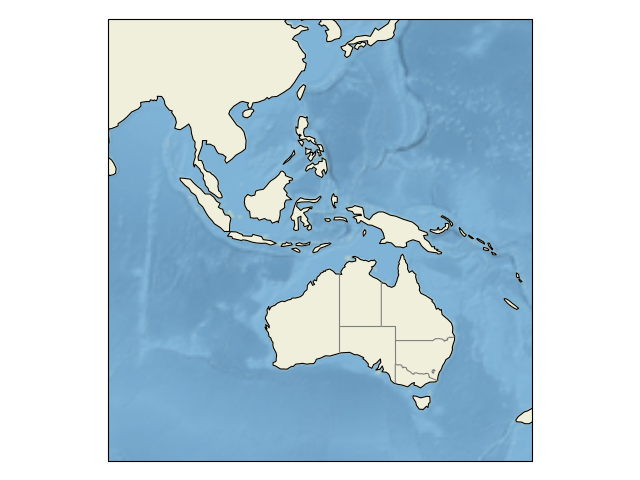
import matplotlib.pyplot as plt

import cartopy.crs as ccrs
import cartopy.feature as cfeature


def main():
    ax = plt.axes(projection=ccrs.PlateCarree())
    ax.set_extent([80, 170, -45, 30])

    # Put a background image on for nice sea rendering.
    ax.stock_img()

    # Create a feature for States/Admin 1 regions at 1:50m from Natural Earth
    states_provinces = cfeature.NaturalEarthFeature(
        category='cultural',
        name='admin_1_states_provinces_lines',
        scale='50m',
        facecolor='none')

    ax.add_feature(cfeature.LAND)
    ax.add_feature(cfeature.COASTLINE)
    ax.add_feature(states_provinces, edgecolor='gray')

    plt.show()


if __name__ == '__main__':
    main()