"""
This example illustrates the automatic download of STRM data, and adding of
shading to create a so-called "Shaded Relief SRTM".
Originally contributed by Thomas Lecocq (http://geophysique.be).
"""
import cartopy.crs as ccrs
from cartopy.io import srtm
import matplotlib.pyplot as plt
from cartopy.io import PostprocessedRasterSource, LocatedImage
from cartopy.io.srtm import SRTM3Source, SRTM1Source
def shade(located_elevations):
"""
Given an array of elevations in a LocatedImage, add a relief (shadows) to
give a realistic 3d appearance.
"""
new_img = srtm.add_shading(located_elevations.image,
azimuth=135, altitude=15)
return LocatedImage(new_img, located_elevations.extent)
def plot(Source, name):
plt.figure()
ax = plt.axes(projection=ccrs.PlateCarree())
# Define a raster source which uses the SRTM data and applies the
# shade function when the data is retrieved.
shaded_srtm = PostprocessedRasterSource(Source(), shade)
# Add the shaded SRTM source to our map with a grayscale colormap.
ax.add_raster(shaded_srtm, cmap='Greys')
# This data is high resolution, so pick a small area which has some
# interesting orography.
ax.set_extent([12, 13, 47, 48])
plt.title(name + " Shaded Relief Map")
gl = ax.gridlines(draw_labels=True)
gl.xlabels_top = False
gl.ylabels_left = False
def main():
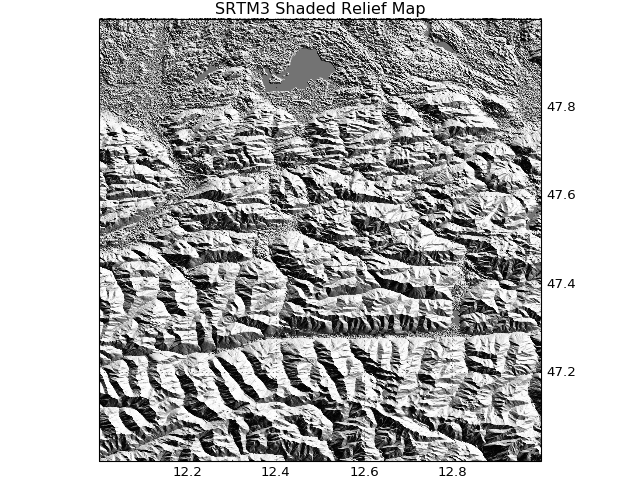
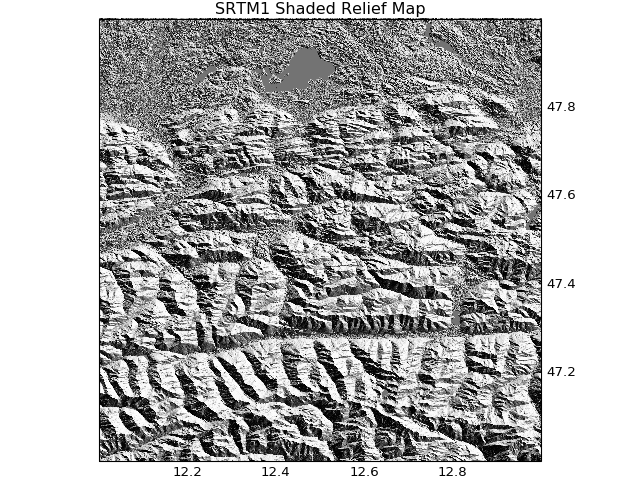
plot(SRTM3Source, 'SRTM3')
plot(SRTM1Source, 'SRTM1')
plt.show()
if __name__ == '__main__':
main()