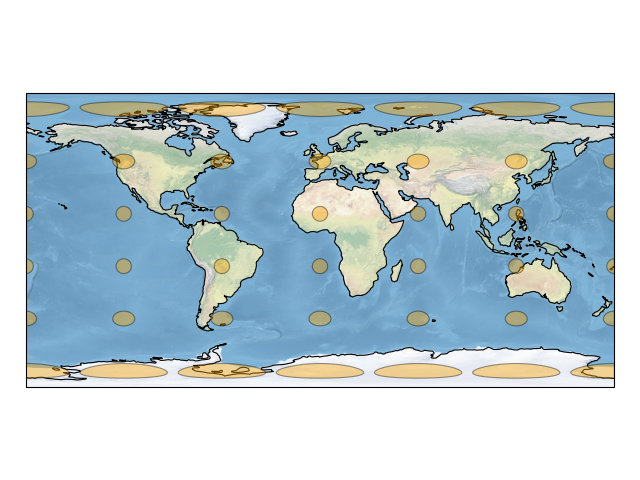
tissot example
import matplotlib.pyplot as plt

import cartopy.crs as ccrs


def main():
    ax = plt.axes(projection=ccrs.PlateCarree())

    # make the map global rather than have it zoom in to
    # the extents of any plotted data
    ax.set_global()

    ax.stock_img()
    ax.coastlines()

    ax.tissot(facecolor='orange', alpha=0.4)

    plt.show()


if __name__ == '__main__':
    main()