"""
Interactive WMTS (Web Map Tile Service)
---------------------------------------
This example demonstrates the interactive pan and zoom capability
supported by an OGC web services Web Map Tile Service (WMTS) aware axes.
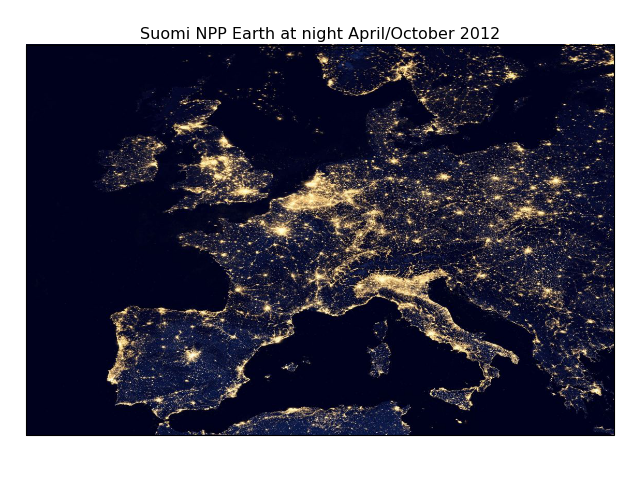
The example WMTS layer is a single composite of data sampled over nine days
in April 2012 and thirteen days in October 2012 showing the Earth at night.
It does not vary over time.
The imagery was collected by the Suomi National Polar-orbiting Partnership
(Suomi NPP) weather satellite operated by the United States National Oceanic
and Atmospheric Administration (NOAA).
"""
import cartopy.crs as ccrs
import matplotlib.pyplot as plt
def main():
url = 'https://map1c.vis.earthdata.nasa.gov/wmts-geo/wmts.cgi'
layer = 'VIIRS_CityLights_2012'
ax = plt.axes(projection=ccrs.PlateCarree())
ax.add_wmts(url, layer)
ax.set_extent((-15, 25, 35, 60))
plt.title('Suomi NPP Earth at night April/October 2012')
plt.show()
if __name__ == '__main__':
main()