import cartopy.crs as ccrs
import matplotlib.pyplot as plt
import numpy as np
import matplotlib.textpath
import matplotlib.patches
from matplotlib.font_manager import FontProperties
def main():
plt.figure(figsize=[8, 8])
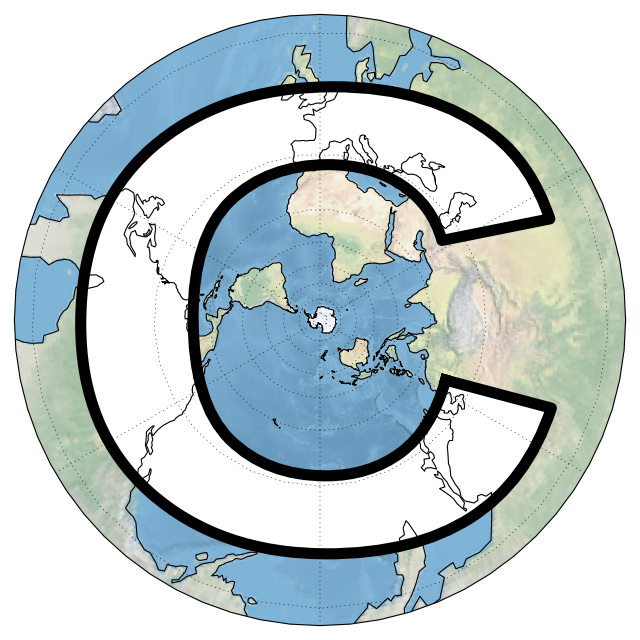
ax = plt.axes(projection=ccrs.SouthPolarStereo())
ax.coastlines()
ax.gridlines()
# Add a background image. Note: unlike the Robinson projection, the
# background image spills outside the boundary due to the fact that
# points outside the boundary have 1:1 mappings in this projection
im = ax.stock_img()
def on_draw(event=None):
"""
Hooks into matplotlib's event mechanism to define the clip path of the
background image.
"""
# Clip the image to the current background boundary.
im.set_clip_path(ax.background_patch.get_path(),
transform=ax.background_patch.get_transform())
# Register the on_draw method and call it once now.
plt.gcf().canvas.mpl_connect('draw_event', on_draw)
on_draw()
# Generate a matplotlib path representing the character "C"
fp = FontProperties(family='Arial', weight='bold')
logo_path = matplotlib.textpath.TextPath((-4.5e7, -3.7e7),
'C', size=1, prop=fp)
# Scale the letter up to an appropriate X and Y scale
logo_path._vertices *= np.array([123500000, 103250000])
# Add the path as a patch, drawing black outlines around the text
patch = matplotlib.patches.PathPatch(logo_path, facecolor='white',
edgecolor='black', linewidth=10,
transform=ccrs.SouthPolarStereo())
ax.add_patch(patch)
plt.show()
if __name__ == '__main__':
main()