
import matplotlib.pyplot as plt
import cartopy.crs as ccrs
from cartopy.examples.arrows import sample_data
def main():
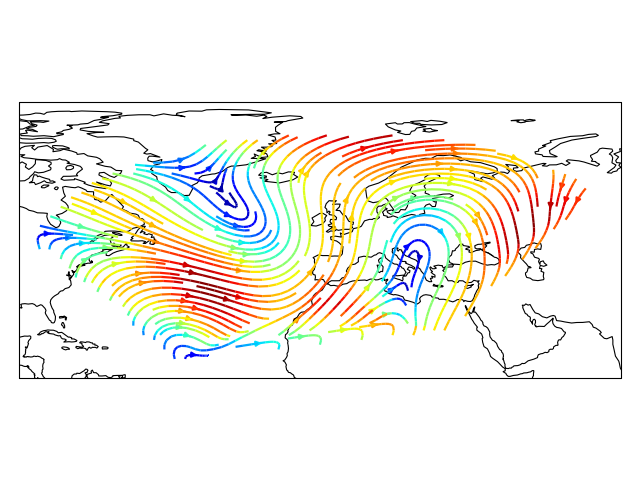
ax = plt.axes(projection=ccrs.PlateCarree())
ax.set_extent([-90, 75, 10, 60])
ax.coastlines()
x, y, u, v, vector_crs = sample_data(shape=(80, 100))
magnitude = (u ** 2 + v ** 2) ** 0.5
ax.streamplot(x, y, u, v, transform=vector_crs,
linewidth=2, density=2, color=magnitude)
plt.show()
if __name__ == '__main__':
main()