import matplotlib.pyplot as plt
import numpy as np
import cartopy
import cartopy.crs as ccrs
def sample_data(shape=(20, 30)):
"""
Returns ``(x, y, u, v, crs)`` of some vector data
computed mathematically. The returned crs will be a rotated
pole CRS, meaning that the vectors will be unevenly spaced in
regular PlateCarree space.
"""
crs = ccrs.RotatedPole(pole_longitude=177.5, pole_latitude=37.5)
x = np.linspace(311.9, 391.1, shape[1])
y = np.linspace(-23.6, 24.8, shape[0])
x2d, y2d = np.meshgrid(x, y)
u = 10 * (2 * np.cos(2 * np.deg2rad(x2d) + 3 * np.deg2rad(y2d + 30)) ** 2)
v = 20 * np.cos(6 * np.deg2rad(x2d))
return x, y, u, v, crs
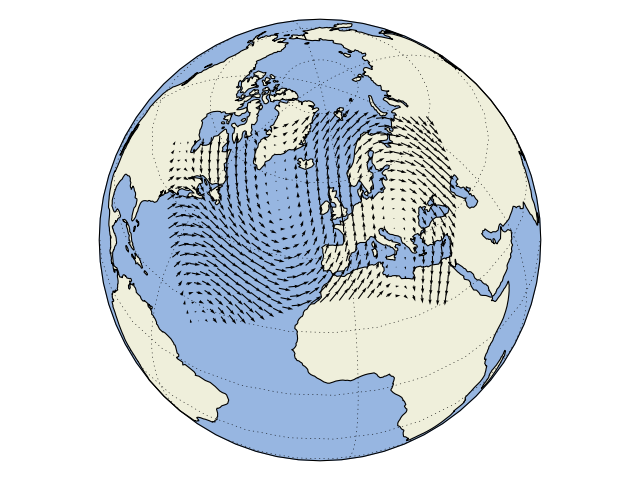
def main():
ax = plt.axes(projection=ccrs.Orthographic(-10, 45))
ax.add_feature(cartopy.feature.OCEAN, zorder=0)
ax.add_feature(cartopy.feature.LAND, zorder=0, edgecolor='black')
ax.set_global()
ax.gridlines()
x, y, u, v, vector_crs = sample_data()
ax.quiver(x, y, u, v, transform=vector_crs)
plt.show()
if __name__ == '__main__':
main()