"""
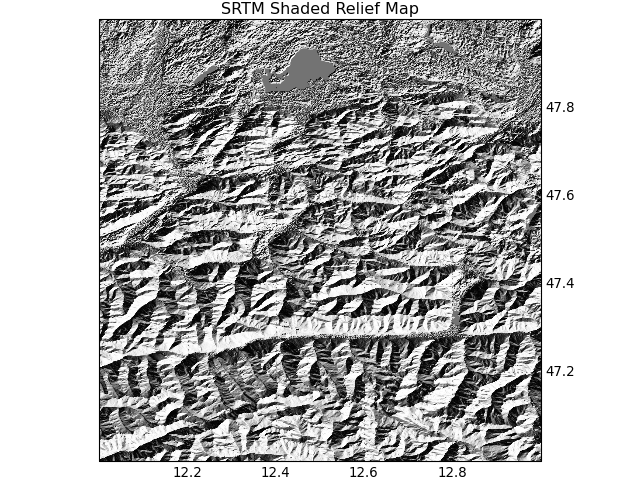
This example illustrates the automatic download of
STRM data, gap filling (using gdal) and adding shading
to create a so-called "Shaded Relief SRTM"
Contributed by: Thomas Lecocq (http://geophysique.be)
"""
import cartopy.crs as ccrs
from cartopy.io import srtm
import matplotlib.pyplot as plt
def main():
ax = plt.axes(projection=ccrs.PlateCarree())
# Get the 1x1 degree SRTM tile for 12E, 47N
elev, crs, extent = srtm.srtm_composite(12, 47, 1, 1)
# Fill the gaps present in the elevation data
elev_filled = srtm.fill_gaps(elev, 15)
# Add shading simulating the Sun at 10am (South-East)
# and with a low angle (15 degrees above horizon)
shaded = srtm.add_shading(elev_filled, 135.0, 15.0)
# The plot the result :
plt.imshow(shaded, extent=extent, transform=crs,
cmap='Greys', origin='lower')
plt.title("SRTM Shaded Relief Map")
gl = ax.gridlines(draw_labels=True)
gl.xlabels_top = False
gl.ylabels_left = False
plt.show()
if __name__ == '__main__':
main()