import cartopy
import matplotlib.pyplot as plt
def main():
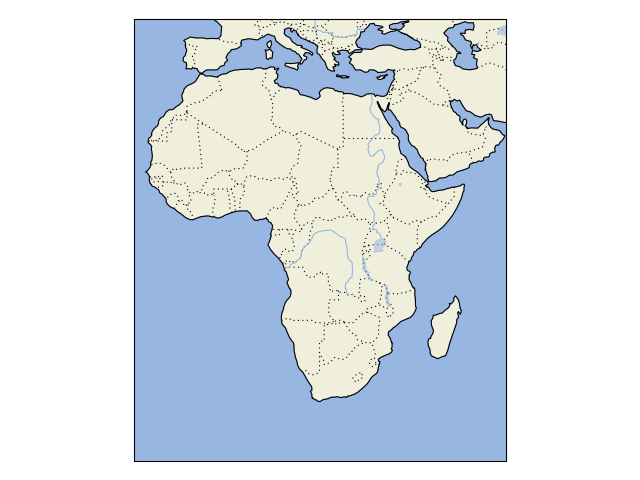
ax = plt.axes(projection=cartopy.crs.PlateCarree())
ax.add_feature(cartopy.feature.LAND)
ax.add_feature(cartopy.feature.OCEAN)
ax.add_feature(cartopy.feature.COASTLINE)
ax.add_feature(cartopy.feature.BORDERS, linestyle=':')
ax.add_feature(cartopy.feature.LAKES, alpha=0.5)
ax.add_feature(cartopy.feature.RIVERS)
ax.set_extent([-20, 60, -40, 40])
plt.show()
if __name__ == '__main__':
main()