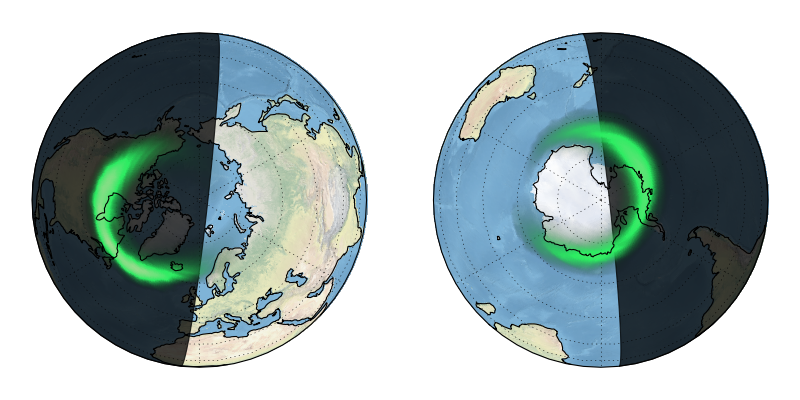
Plotting the Aurora Forecast from NOAA on Orthographic Polar Projection
The National Oceanic and Atmospheric Administration (NOAA) monitors the solar wind conditions using the ACE spacecraft orbiting close to the L1 Lagrangian point of the Sun-Earth system. This data is fed into the OVATION-Prime model to forecast the probability of visible aurora at various locations on Earth. Every five minutes a new forecast is published for the coming 30 minutes. The data is provided as a 1024 by 512 grid of probabilities in percent of visible aurora. The data spaced equally in degrees from -180 to 180 and -90 to 90.
"""
Plotting the Aurora Forecast from NOAA on Orthographic Polar Projection
-----------------------------------------------------------------------

The National Oceanic and Atmospheric Administration (NOAA) monitors the
solar wind conditions using the ACE spacecraft orbiting close to the L1
Lagrangian point of the Sun-Earth system. This data is fed into the
OVATION-Prime model to forecast the probability of visible aurora at
various locations on Earth. Every five minutes a new forecast is
published for the coming 30 minutes. The data is provided as a
1024 by 512 grid of probabilities in percent of visible aurora. The
data spaced equally in degrees from -180 to 180 and -90 to 90.

"""
try:
    from urllib2 import urlopen
except ImportError:
    from urllib.request import urlopen

from io import StringIO

import numpy as np
from datetime import datetime
import cartopy.crs as ccrs
import matplotlib.pyplot as plt
from matplotlib.colors import LinearSegmentedColormap
import matplotlib.patches as patches


def aurora_forecast():
    """
    Gets the latest Aurora Forecast from http://swpc.noaa.gov.

    Returns
    -------
    img : numpy array
        The pixels of the image in a numpy array.
    img_proj : cartopy CRS
        The rectangular coordinate system of the image.
    img_extent : tuple of floats
        The extent of the image ``(x0, y0, x1, y1)`` referenced in
        the ``img_proj`` coordinate system.
    origin : str
        The origin of the image to be passed through to matplotlib's imshow.
    dt : datetime
        Time of forecast validity.

    """

    # GitHub gist to download the example data from
    url = ('https://gist.githubusercontent.com/belteshassar/'
           'c7ea9e02a3e3934a9ddc/raw/aurora-nowcast-map.txt')
    # To plot the current forecast instead, uncomment the following line
    # url = 'http://services.swpc.noaa.gov/text/aurora-nowcast-map.txt'

    response_text = StringIO(urlopen(url).read().decode('utf-8'))
    img = np.loadtxt(response_text)
    # Read forecast date and time
    response_text.seek(0)
    for line in response_text:
        if line.startswith('Product Valid At:', 2):
            dt = datetime.strptime(line[-17:-1], '%Y-%m-%d %H:%M')

    img_proj = ccrs.PlateCarree()
    img_extent = (-180, 180, -90, 90)
    return img, img_proj, img_extent, 'lower', dt


def aurora_cmap():
    """Return a colormap with aurora like colors"""
    stops = {'red': [(0.00, 0.1725, 0.1725),
                     (0.50, 0.1725, 0.1725),
                     (1.00, 0.8353, 0.8353)],

             'green': [(0.00, 0.9294, 0.9294),
                       (0.50, 0.9294, 0.9294),
                       (1.00, 0.8235, 0.8235)],

             'blue': [(0.00, 0.3843, 0.3843),
                      (0.50, 0.3843, 0.3843),
                      (1.00, 0.6549, 0.6549)],

             'alpha': [(0.00, 0.0, 0.0),
                       (0.50, 1.0, 1.0),
                       (1.00, 1.0, 1.0)]}

    return LinearSegmentedColormap('aurora', stops)


def sun_pos(dt=None):
    """This function computes a rough estimate of the coordinates for
    the point on the surface of the Earth where the Sun is directly
    overhead at the time dt. Precision is down to a few degrees. This
    means that the equinoxes (when the sign of the latitude changes)
    will be off by a few days.

    The function is intended only for visualization. For more precise
    calculations consider for example the PyEphem package.

    Parameters
    ----------
        dt: datetime
            Defaults to datetime.utcnow()

    Returns
    -------
        lat, lng: tuple of floats
            Approximate coordinates of the point where the sun is
            in zenith at the time dt.
    """
    if dt is None:
        dt = datetime.utcnow()

    axial_tilt = 23.4
    ref_solstice = datetime(2016, 6, 21, 22, 22)
    days_per_year = 365.2425
    seconds_per_day = 24*60*60.0

    days_since_ref = (dt - ref_solstice).total_seconds()/seconds_per_day
    lat = axial_tilt*np.cos(2*np.pi*days_since_ref/days_per_year)
    sec_since_midnight = (dt - datetime(dt.year, dt.month, dt.day)).seconds
    lng = -(sec_since_midnight/seconds_per_day - 0.5)*360
    return lat, lng


def fill_dark_side(ax, time=None, *args, **kwargs):
    """
    Plot a fill on the dark side of the planet (without refraction).

    Parameters
    ----------
        ax : matplotlib axes
            The axes to plot on.
        time : datetime
            The time to calculate terminator for. Defaults to datetime.utcnow()
        **kwargs :
            Passed on to Matplotlib's ax.fill()

    """
    lat, lng = sun_pos(time)
    pole_lng = lng
    if lat > 0:
        pole_lat = -90 + lat
        central_rot_lng = 180
    else:
        pole_lat = 90 + lat
        central_rot_lng = 0

    rotated_pole = ccrs.RotatedPole(pole_latitude=pole_lat,
                                    pole_longitude=pole_lng,
                                    central_rotated_longitude=central_rot_lng)

    x = [-90]*181 + [90]*181 + [-90]
    y = range(-90, 91) + range(90, -91, -1) + [-90]

    ax.fill(x, y, transform=rotated_pole, **kwargs)


def main():
    fig = plt.figure(figsize=[10, 5])

    # We choose to plot in an Orthographic projection as it looks natural
    # and the distortion is relatively small around the poles where
    # the aurora is most likely.

    # ax1 for Northern Hemisphere
    ax1 = plt.subplot(1, 2, 1, projection=ccrs.Orthographic(0, 90))

    # ax2 for Southern Hemisphere
    ax2 = plt.subplot(1, 2, 2, projection=ccrs.Orthographic(180, -90))

    img, crs, extent, origin, dt = aurora_forecast()

    for ax in [ax1, ax2]:
        ax.coastlines(zorder=3)
        ax.stock_img()
        ax.gridlines()
        fill_dark_side(ax, time=dt, color='black', alpha=0.75)
        ax.imshow(img, vmin=0, vmax=100, transform=crs,
                  extent=extent, origin=origin, zorder=2,
                  cmap=aurora_cmap())

    plt.show()


if __name__ == '__main__':
    main()