Cartopy map gridlines and tick labels
The Gridliner instance, often created by calling the
cartopy.mpl.geoaxes.GeoAxes.gridlines() method on a
cartopy.mpl.geoaxes.GeoAxes instance, has a variety of attributes which can be
used to determine draw time behaviour of the gridlines and labels.
Important
The current Gridliner interface is likely to undergo
a significant change in the versions following v0.6 in order to fix some of the underying
limitations of the current implementation.
-
class
cartopy.mpl.gridliner.Gridliner(axes, crs, draw_labels=False, xlocator=None, ylocator=None, collection_kwargs=None)[source]¶ Object used by
cartopy.mpl.geoaxes.GeoAxes.gridlines()to add gridlines and tick labels to a map.Args:
- axes
The
cartopy.mpl.geoaxes.GeoAxesobject to be drawn on.
- crs
The
cartopy.crs.CRSdefining the coordinate system that the gridlines are drawn in.
- draw_labels
Toggle whether to draw labels. For finer control, attributes of
Gridlinermay be modified individually.
- xlocator
A
matplotlib.ticker.Locatorinstance which will be used to determine the locations of the gridlines in the x-coordinate of the given CRS. Defaults to None, which implies automatic locating of the gridlines.
- ylocator
A
matplotlib.ticker.Locatorinstance which will be used to determine the locations of the gridlines in the y-coordinate of the given CRS. Defaults to None, which implies automatic locating of the gridlines.
- collection_kwargs
Dictionary controlling line properties, passed to
matplotlib.collections.Collection.
-
collection_kwargs= None¶ A dictionary passed through to
matplotlib.collections.LineCollectionon grid line creation.
-
n_steps= None¶ The number of interpolation points which are used to draw the gridlines.
-
xlabel_artists= None¶ The x labels which were created at draw time.
-
xlabel_style= None¶ A dictionary passed through to
ax.texton x label creation for styling of the text labels.
-
xlabels_bottom= None¶ Whether to draw labels on the bottom of the map.
-
xlabels_top= None¶ Whether to draw labels on the top of the map.
-
xline_artists= None¶ The x gridlines which were created at draw time.
-
xlines= None¶ Whether to draw the x gridlines.
-
ylabel_artists= None¶ The y labels which were created at draw time.
-
ylabel_style= None¶ A dictionary passed through to
ax.texton y label creation for styling of the text labels.
-
ylabels_left= None¶ Whether to draw labels on the left hand side of the map.
-
ylabels_right= None¶ Whether to draw labels on the right hand side of the map.
-
yline_artists= None¶ The y gridlines which were created at draw time.
-
ylines= None¶ Whether to draw the y gridlines.
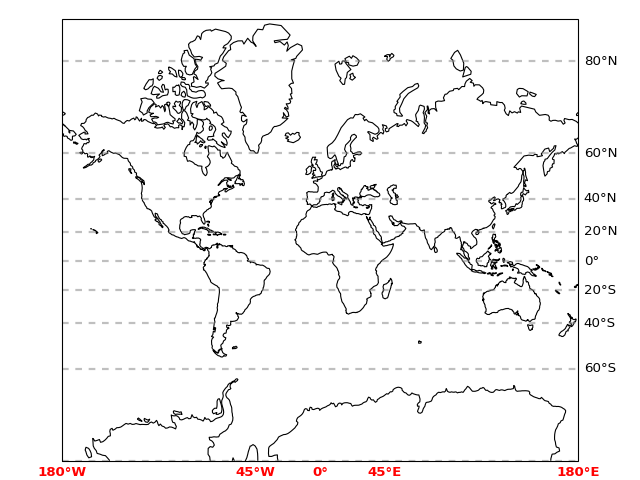
The following contrived example makes use of many of the features of the Gridliner class to produce customized gridlines and tick labels:
import matplotlib.pyplot as plt
import matplotlib.ticker as mticker
import cartopy.crs as ccrs

from cartopy.mpl.gridliner import LONGITUDE_FORMATTER, LATITUDE_FORMATTER


ax = plt.axes(projection=ccrs.Mercator())
ax.coastlines()

gl = ax.gridlines(crs=ccrs.PlateCarree(), draw_labels=True,
                  linewidth=2, color='gray', alpha=0.5, linestyle='--')
gl.xlabels_top = False
gl.ylabels_left = False
gl.xlines = False
gl.xlocator = mticker.FixedLocator([-180, -45, 0, 45, 180])
gl.xformatter = LONGITUDE_FORMATTER
gl.yformatter = LATITUDE_FORMATTER
gl.xlabel_style = {'size': 15, 'color': 'gray'}
gl.xlabel_style = {'color': 'red', 'weight': 'bold'}

plt.show()