"""
Using Cartopy and AxesGrid toolkit
----------------------------------
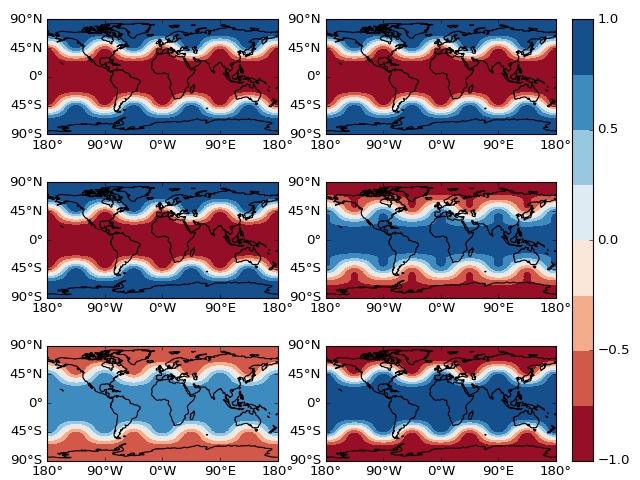
This example demonstrates how to use cartopy `GeoAxes` with
`AxesGrid` from the `mpl_toolkits.axes_grid1`.
The script constructs an `axes_class` kwarg with Plate Carree projection
and passes it to the `AxesGrid` instance. The `AxesGrid` built-in
labelling is switched off, and instead a standard procedure
of creating grid lines is used. Then some fake data is plotted.
"""
import cartopy.crs as ccrs
from cartopy.mpl.geoaxes import GeoAxes
from cartopy.mpl.ticker import LongitudeFormatter, LatitudeFormatter
import matplotlib.pyplot as plt
from mpl_toolkits.axes_grid1 import AxesGrid
import numpy as np
def sample_data_3d(shape):
"""Returns `lons`, `lats`, `times` and fake `data`"""
ntimes, nlats, nlons = shape
lats = np.linspace(-np.pi / 2, np.pi / 2, nlats)
lons = np.linspace(0, 2 * np.pi, nlons)
lons, lats = np.meshgrid(lons, lats)
wave = 0.75 * (np.sin(2 * lats) ** 8) * np.cos(4 * lons)
mean = 0.5 * np.cos(2 * lats) * ((np.sin(2 * lats)) ** 2 + 2)
lats = np.rad2deg(lats)
lons = np.rad2deg(lons)
data = wave + mean
times = np.linspace(-1, 1, ntimes)
new_shape = data.shape + (ntimes, )
data = np.rollaxis(data.repeat(ntimes).reshape(new_shape), -1)
data *= times[:, np.newaxis, np.newaxis]
return lons, lats, times, data
def main():
projection = ccrs.PlateCarree()
axes_class = (GeoAxes,
dict(map_projection=projection))
lons, lats, times, data = sample_data_3d((6, 73, 145))
fig = plt.figure()
axgr = AxesGrid(fig, 111, axes_class=axes_class,
nrows_ncols=(3, 2),
axes_pad=0.6,
cbar_location='right',
cbar_mode='single',
cbar_pad=0.2,
cbar_size='3%',
label_mode='') # note the empty label_mode
for i, ax in enumerate(axgr):
ax.coastlines()
ax.set_xticks(np.linspace(-180, 180, 5), crs=projection)
ax.set_yticks(np.linspace(-90, 90, 5), crs=projection)
lon_formatter = LongitudeFormatter(zero_direction_label=True)
lat_formatter = LatitudeFormatter()
ax.xaxis.set_major_formatter(lon_formatter)
ax.yaxis.set_major_formatter(lat_formatter)
p = ax.contourf(lons, lats, data[i, ...],
transform=projection,
cmap='RdBu')
axgr.cbar_axes[0].colorbar(p)
plt.show()
if __name__ == '__main__':
main()