
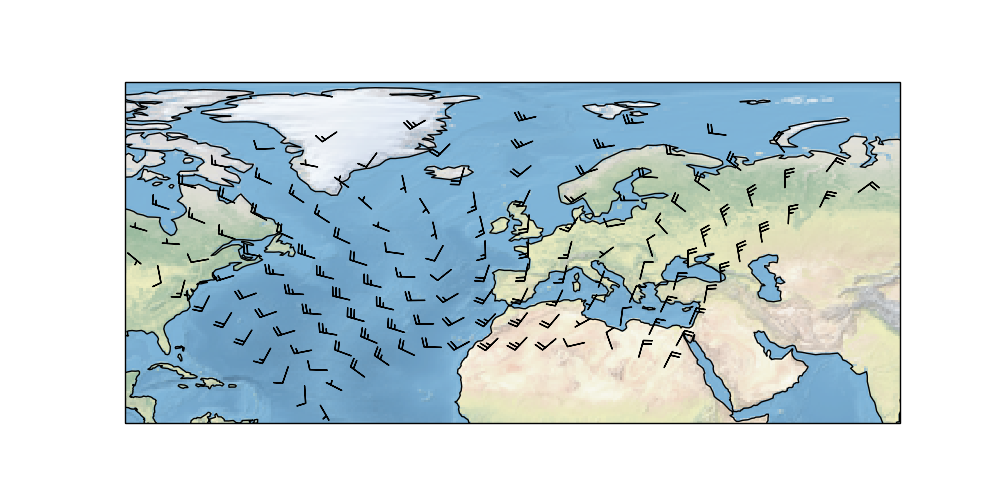
Barbs
Plotting barbs.
import matplotlib.pyplot as plt

import cartopy.crs as ccrs
from cartopy.examples.arrows import sample_data


def main():
    fig = plt.figure(figsize=(10, 5))
    ax = fig.add_subplot(1, 1, 1, projection=ccrs.PlateCarree())
    ax.set_extent([-90, 80, 10, 85], crs=ccrs.PlateCarree())
    ax.stock_img()
    ax.coastlines()

    x, y, u, v, vector_crs = sample_data(shape=(10, 14))
    ax.barbs(x, y, u, v, length=5,
             sizes=dict(emptybarb=0.25, spacing=0.2, height=0.5),
             linewidth=0.95, transform=vector_crs)

    plt.show()


if __name__ == '__main__':
    main()
Total running time of the script: ( 0 minutes 0.124 seconds)