Hurricane Katrina
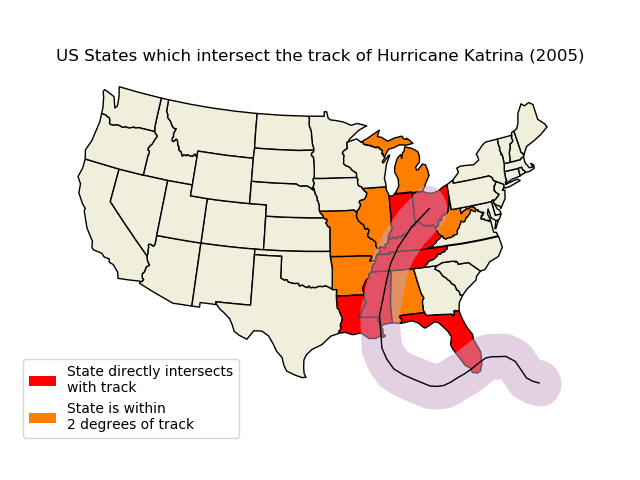
This example uses the power of Shapely to illustrate states that are likely to have been significantly impacted by Hurricane Katrina.

import matplotlib.patches as mpatches
import matplotlib.pyplot as plt
import shapely.geometry as sgeom

import cartopy.crs as ccrs
import cartopy.io.shapereader as shpreader


def sample_data():
    """
    Return a list of latitudes and a list of longitudes (lons, lats)
    for Hurricane Katrina (2005).

    The data was originally sourced from the HURDAT2 dataset from AOML/NOAA:
    http://www.aoml.noaa.gov/hrd/hurdat/newhurdat-all.html on 14th Dec 2012.

    """
    lons = [-75.1, -75.7, -76.2, -76.5, -76.9, -77.7, -78.4, -79.0,
            -79.6, -80.1, -80.3, -81.3, -82.0, -82.6, -83.3, -84.0,
            -84.7, -85.3, -85.9, -86.7, -87.7, -88.6, -89.2, -89.6,
            -89.6, -89.6, -89.6, -89.6, -89.1, -88.6, -88.0, -87.0,
            -85.3, -82.9]

    lats = [23.1, 23.4, 23.8, 24.5, 25.4, 26.0, 26.1, 26.2, 26.2, 26.0,
            25.9, 25.4, 25.1, 24.9, 24.6, 24.4, 24.4, 24.5, 24.8, 25.2,
            25.7, 26.3, 27.2, 28.2, 29.3, 29.5, 30.2, 31.1, 32.6, 34.1,
            35.6, 37.0, 38.6, 40.1]

    return lons, lats


def main():
    fig = plt.figure()
    ax = fig.add_axes([0, 0, 1, 1], projection=ccrs.LambertConformal())

    ax.set_extent([-125, -66.5, 20, 50], ccrs.Geodetic())

    shapename = 'admin_1_states_provinces_lakes_shp'
    states_shp = shpreader.natural_earth(resolution='110m',
                                         category='cultural', name=shapename)

    lons, lats = sample_data()

    # to get the effect of having just the states without a map "background"
    # turn off the outline and background patches
    ax.background_patch.set_visible(False)
    ax.outline_patch.set_visible(False)

    ax.set_title('US States which intersect the track of '
                 'Hurricane Katrina (2005)')

    # turn the lons and lats into a shapely LineString
    track = sgeom.LineString(zip(lons, lats))

    # buffer the linestring by two degrees (note: this is a non-physical
    # distance)
    track_buffer = track.buffer(2)

    for state in shpreader.Reader(states_shp).geometries():
        # pick a default color for the land with a black outline,
        # this will change if the storm intersects with our track
        facecolor = [0.9375, 0.9375, 0.859375]
        edgecolor = 'black'

        if state.intersects(track):
            facecolor = 'red'
        elif state.intersects(track_buffer):
            facecolor = '#FF7E00'

        ax.add_geometries([state], ccrs.PlateCarree(),
                          facecolor=facecolor, edgecolor=edgecolor)

    ax.add_geometries([track_buffer], ccrs.PlateCarree(),
                      facecolor='#C8A2C8', alpha=0.5)
    ax.add_geometries([track], ccrs.PlateCarree(),
                      facecolor='none', edgecolor='k')

    # make two proxy artists to add to a legend
    direct_hit = mpatches.Rectangle((0, 0), 1, 1, facecolor="red")
    within_2_deg = mpatches.Rectangle((0, 0), 1, 1, facecolor="#FF7E00")
    labels = ['State directly intersects\nwith track',
              'State is within \n2 degrees of track']
    ax.legend([direct_hit, within_2_deg], labels,
              loc='lower left', bbox_to_anchor=(0.025, -0.1), fancybox=True)

    plt.show()


if __name__ == '__main__':
    main()
Total running time of the script: ( 0 minutes 0.348 seconds)
