
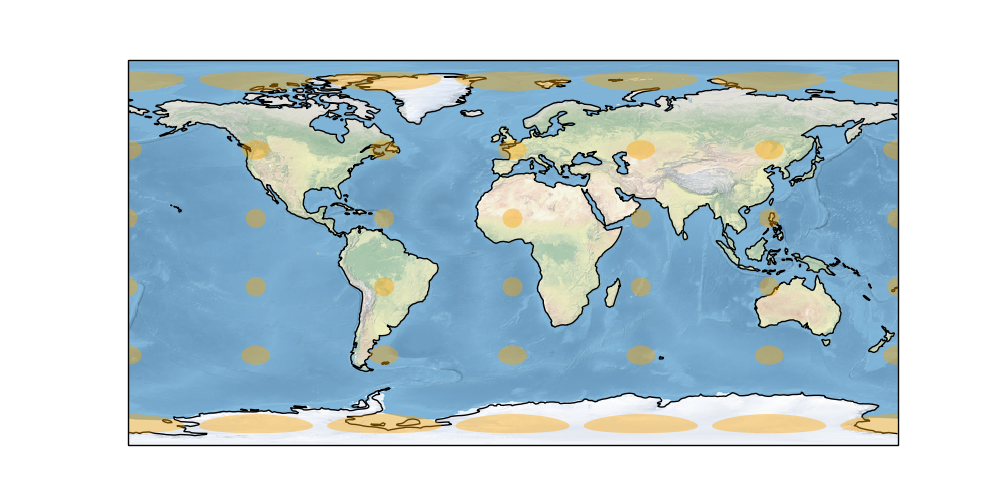
Tissot’s Indicatrix
Visualize Tissot’s indicatrix on a map.
import matplotlib.pyplot as plt

import cartopy.crs as ccrs


def main():
    fig = plt.figure(figsize=(10, 5))
    ax = fig.add_subplot(1, 1, 1, projection=ccrs.PlateCarree())

    # make the map global rather than have it zoom in to
    # the extents of any plotted data
    ax.set_global()

    ax.stock_img()
    ax.coastlines()

    ax.tissot(facecolor='orange', alpha=0.4)

    plt.show()


if __name__ == '__main__':
    main()
Total running time of the script: ( 0 minutes 0.119 seconds)