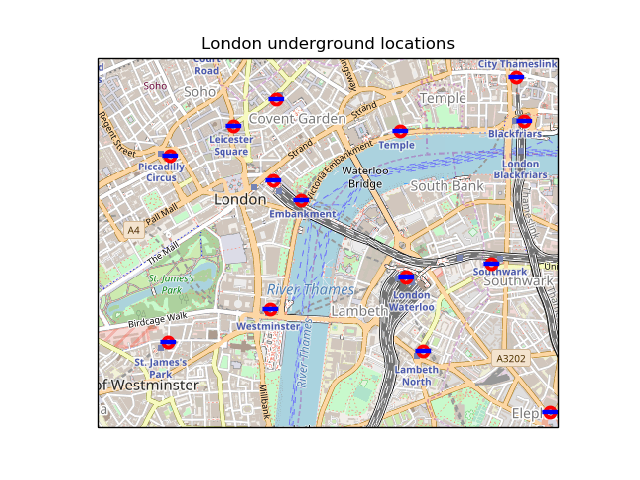
Tube Stations
Produces a map showing London Underground station locations with high resolution background imagery provided by OpenStreetMap.
from matplotlib.path import Path
import matplotlib.pyplot as plt
import numpy as np

import cartopy.crs as ccrs
from cartopy.io.img_tiles import OSM


def tube_locations():
    """
    Return an (n, 2) array of selected London Tube locations in Ordnance
    Survey GB coordinates.

    Source: http://www.doogal.co.uk/london_stations.php

    """
    return np.array([[531738., 180890.], [532379., 179734.],
                     [531096., 181642.], [530234., 180492.],
                     [531688., 181150.], [530242., 180982.],
                     [531940., 179144.], [530406., 180380.],
                     [529012., 180283.], [530553., 181488.],
                     [531165., 179489.], [529987., 180812.],
                     [532347., 180962.], [529102., 181227.],
                     [529612., 180625.], [531566., 180025.],
                     [529629., 179503.], [532105., 181261.],
                     [530995., 180810.], [529774., 181354.],
                     [528941., 179131.], [531050., 179933.],
                     [530240., 179718.]])


def main():
    imagery = OSM()

    fig = plt.figure()
    ax = fig.add_subplot(1, 1, 1, projection=imagery.crs)
    ax.set_extent([-0.14, -0.1, 51.495, 51.515], ccrs.PlateCarree())

    # Construct concentric circles and a rectangle,
    # suitable for a London Underground logo.
    theta = np.linspace(0, 2 * np.pi, 100)
    circle_verts = np.vstack([np.sin(theta), np.cos(theta)]).T
    concentric_circle = Path.make_compound_path(Path(circle_verts[::-1]),
                                                Path(circle_verts * 0.6))

    rectangle = Path([[-1.1, -0.2], [1, -0.2], [1, 0.3], [-1.1, 0.3]])

    # Add the imagery to the map.
    ax.add_image(imagery, 14)

    # Plot the locations twice, first with the red concentric circles,
    # then with the blue rectangle.
    xs, ys = tube_locations().T
    ax.plot(xs, ys, transform=ccrs.OSGB(),
            marker=concentric_circle, color='red', markersize=9, linestyle='')
    ax.plot(xs, ys, transform=ccrs.OSGB(),
            marker=rectangle, color='blue', markersize=11, linestyle='')

    ax.set_title('London underground locations')
    plt.show()


if __name__ == '__main__':
    main()
Total running time of the script: ( 0 minutes 0.063 seconds)