
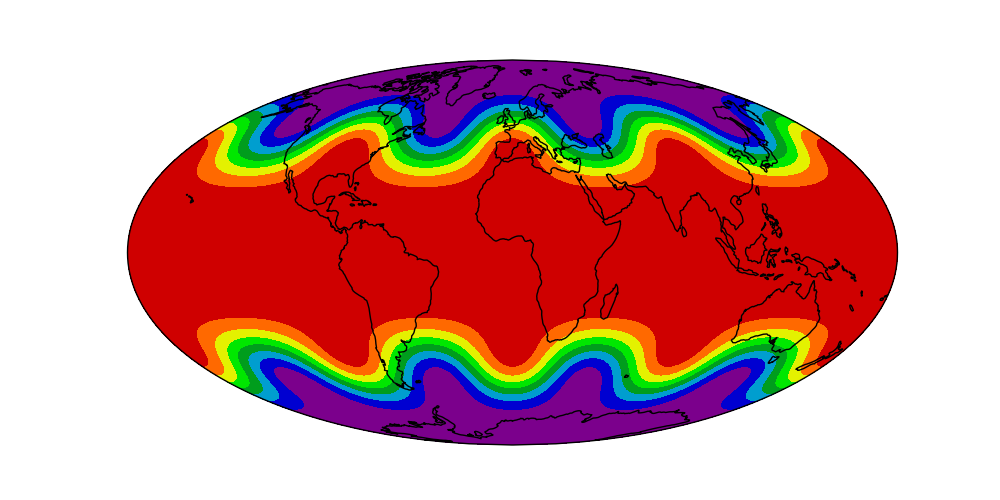
Filled contours
An example of contourf on manufactured data.
import matplotlib.pyplot as plt
import numpy as np

import cartopy.crs as ccrs


def sample_data(shape=(73, 145)):
    """Return ``lons``, ``lats`` and ``data`` of some fake data."""
    nlats, nlons = shape
    lats = np.linspace(-np.pi / 2, np.pi / 2, nlats)
    lons = np.linspace(0, 2 * np.pi, nlons)
    lons, lats = np.meshgrid(lons, lats)
    wave = 0.75 * (np.sin(2 * lats) ** 8) * np.cos(4 * lons)
    mean = 0.5 * np.cos(2 * lats) * ((np.sin(2 * lats)) ** 2 + 2)

    lats = np.rad2deg(lats)
    lons = np.rad2deg(lons)
    data = wave + mean

    return lons, lats, data


def main():
    fig = plt.figure(figsize=(10, 5))
    ax = fig.add_subplot(1, 1, 1, projection=ccrs.Mollweide())

    lons, lats, data = sample_data()

    ax.contourf(lons, lats, data,
                transform=ccrs.PlateCarree(),
                cmap='nipy_spectral')
    ax.coastlines()
    ax.set_global()
    plt.show()


if __name__ == '__main__':
    main()
Total running time of the script: ( 0 minutes 1.453 seconds)