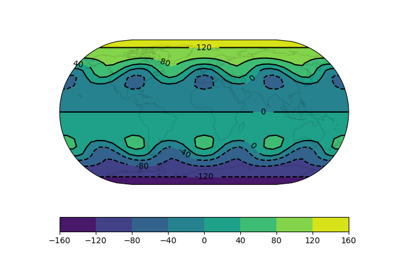
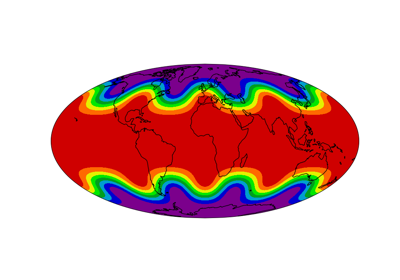
Navigation

  • index
  • outline |
  • next |
  • previous |
  • home| 
  • gallery| 
  • Cartopy Gallery

Cartopy Gallery

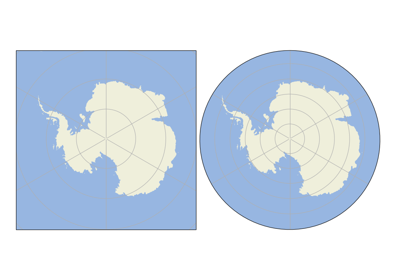
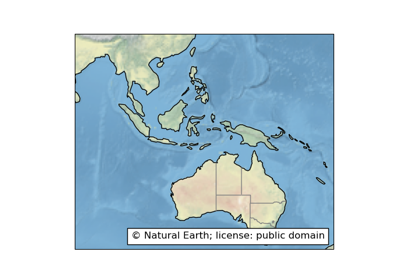
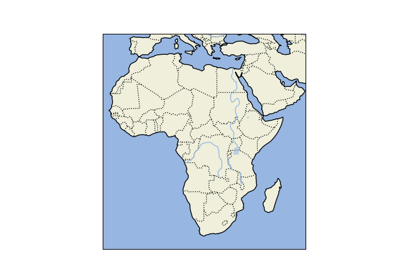
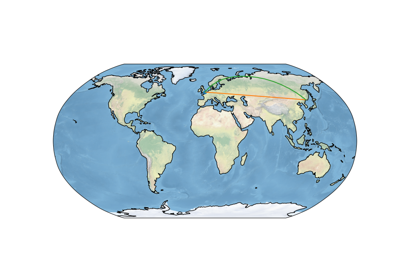
The following examples show off the functionality of Cartopy. They illustrate the kinds of things you can do with this library. For more examples, tutorials, and guides on how to use Cartopy, see the getting started section.

Lines and polygons

Custom Boundary Shape

Custom Boundary Shape

Feature Creation

Feature Creation

Features

Features

Global Map

Global Map

Hurricane Katrina

Hurricane Katrina

Nightshade feature

Nightshade feature

Rotated pole boxes

Rotated pole boxes

The effect of badly referencing an ellipse

The effect of badly referencing an ellipse

Tissot's Indicatrix

Tissot’s Indicatrix

Scalar data

Contour labels

Contour labels

Filled contours

Filled contours

Map tile acquisition

Map tile acquisition

Plotting the Aurora Forecast from NOAA on Orthographic Polar Projection

Plotting the Aurora Forecast from NOAA on Orthographic Polar Projection

Reprojecting images from a Geostationary projection

Reprojecting images from a Geostationary projection

Vector data

Arrows

Arrows

Barbs

Barbs

Regridding vectors with quiver

Regridding vectors with quiver

Streamplot

Streamplot

Web services

Displaying WMTS tiled map data on an arbitrary projection

Displaying WMTS tiled map data on an arbitrary projection

Interactive WMS (Web Map Service)

Interactive WMS (Web Map Service)

Interactive WMTS (Web Map Tile Service)

Interactive WMTS (Web Map Tile Service)

Web Map Tile Service time dimension demonstration

Web Map Tile Service time dimension demonstration

Web tile imagery

Web tile imagery

Gridlines and labels

Gridlines and tick labels

Gridlines and tick labels

Tick Labels

Tick Labels

Miscellanea

Animating a gridded surface

Animating a gridded surface

Cartopy Favicon

Cartopy Favicon

Cartopy Logo

Cartopy Logo

Displaying all 60 zones of the UTM projection

Displaying all 60 zones of the UTM projection

Displaying data on an eccentric ellipse

Displaying data on an eccentric ellipse

Modifying the boundary/neatline of a map in cartopy

Modifying the boundary/neatline of a map in cartopy

Tube Stations

Tube Stations

UN Flag

UN Flag

Using Cartopy and AxesGrid toolkit

Using Cartopy and AxesGrid toolkit

Download all examples in Python source code: gallery_python.zip

Download all examples in Jupyter notebooks: gallery_jupyter.zip

Gallery generated by Sphinx-Gallery

Cartopy

Table of Contents

  • Cartopy Gallery
    • Lines and polygons
    • Scalar data
    • Vector data
    • Web services
    • Gridlines and labels
    • Miscellanea

Previous topic

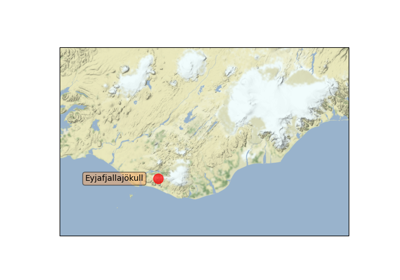
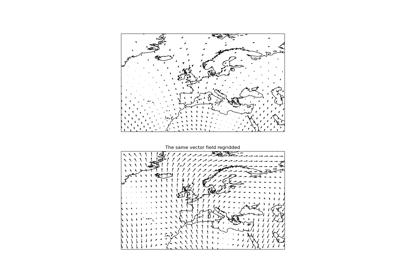
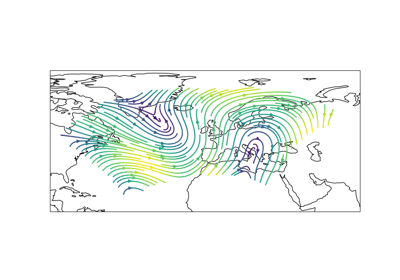
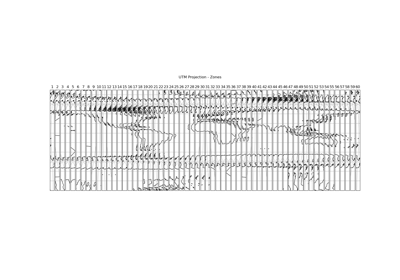
Miscellaneous cartopy utilities

Next topic

Custom Boundary Shape

This Page

  • Show Source

Quick search

Navigation

  • index
  • outline |
  • next |
  • previous |
  • home| 
  • gallery| 
  • Cartopy Gallery

Documentation licensed under the Open Government Licence

© British Crown Copyright 2011 - 2018, Met Office Created using Sphinx 3.5.4.