Ctrl+K
Logo image

Site Navigation

  • Getting started
  • Gallery
  • Installation
  • API reference
  • What’s new

Site Navigation

  • Getting started
  • Gallery
  • Installation
  • API reference
  • What’s new

Section Navigation

  • Lines and polygons
    • Custom Boundary Shape
    • Feature Creation
    • Features
    • Global Map
    • Hurricane Katrina
    • Nightshade feature
    • Ocean bathymetry
    • Rotated pole boxes
    • The effect of badly referencing an ellipse
    • Tissot’s Indicatrix
  • Scalar data
    • Adding a cyclic point to help with wrapping of global data
    • Contour labels
    • Contour transform options
    • Filled contours
    • Map tile acquisition
    • Plotting the Aurora Forecast from NOAA on Orthographic Polar Projection
    • Reprojecting images from a Geostationary projection
  • Vector data
    • Arrows
    • Barbs
    • Regridding vectors with quiver
    • Streamplot
  • Web services
    • Displaying WMTS tiled map data on an arbitrary projection
    • Interactive WMS (Web Map Service)
    • Interactive WMTS (Web Map Tile Service)
    • Web Map Tile Service time dimension demonstration
    • Web tile imagery
  • Gridlines and labels
    • Gridlines and tick labels
    • Tick Labels
  • Miscellanea
    • Animating a gridded surface
    • Cartopy Favicon
    • Cartopy Logo
    • Displaying all 60 zones of the UTM projection
    • Displaying data on an eccentric ellipse
    • Modifying the boundary/neatline of a map in cartopy
    • Tube Stations
    • UN Flag
    • Using Cartopy and AxesGrid toolkit
  • Gallery
  • Miscellanea
  • Cartopy Logo

Note

Go to the end to download the full example code

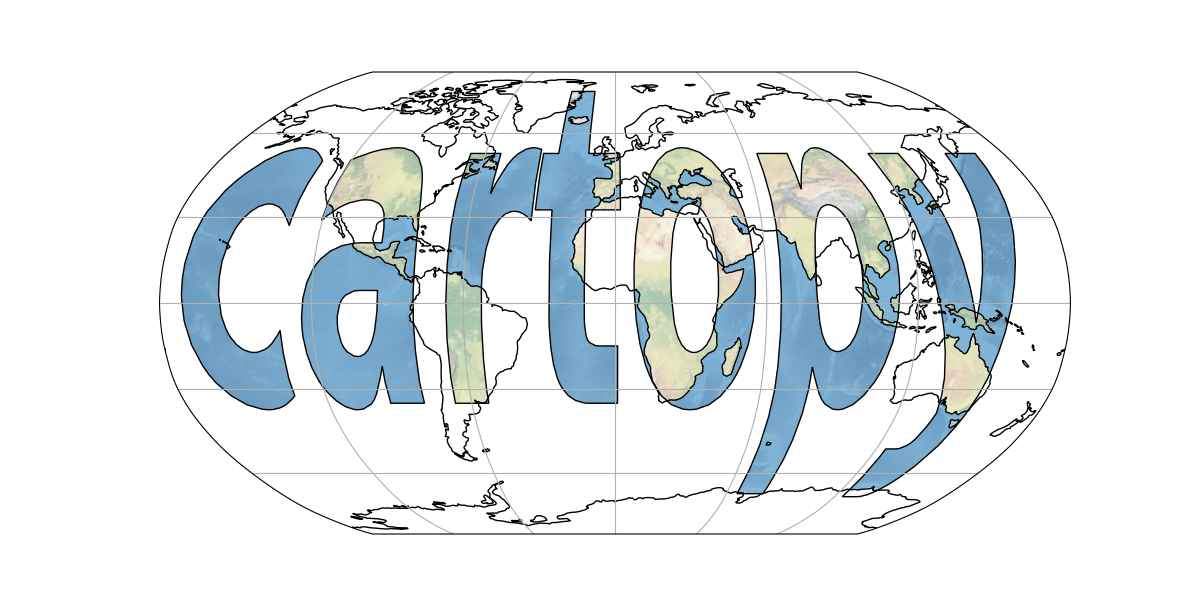
Cartopy Logo#

The actual code to produce cartopy’s logo.
logo
from matplotlib.font_manager import FontProperties
import matplotlib.patches
import matplotlib.pyplot as plt
import matplotlib.textpath
import matplotlib.transforms

import cartopy.crs as ccrs


def main():
    fig = plt.figure(figsize=[12, 6])
    ax = fig.add_subplot(1, 1, 1, projection=ccrs.Robinson())

    ax.coastlines()
    ax.gridlines()

    # generate a matplotlib path representing the word "cartopy"
    fp = FontProperties(family='DejaVu Sans', weight='bold')
    logo_path = matplotlib.textpath.TextPath((-175, -35), 'cartopy',
                                             size=80, prop=fp)
    # scale the letters up to sensible longitude and latitude sizes
    transform = matplotlib.transforms.Affine2D().scale(1, 2).translate(0, 35)

    # add a background image
    im = ax.stock_img()
    # Apply the scale transform and then the map coordinate transform
    plate_carree_transform = (transform +
                              ccrs.PlateCarree()._as_mpl_transform(ax))

    # add the path as a patch, drawing black outlines around the text
    patch = matplotlib.patches.PathPatch(logo_path,
                                         facecolor='none', edgecolor='black',
                                         transform=plate_carree_transform)
    im.set_clip_path(patch)
    ax.add_patch(patch)

    plt.show()


if __name__ == '__main__':
    main()

Total running time of the script: ( 0 minutes 1.335 seconds)

Download Python source code: logo.py

Download Jupyter notebook: logo.ipynb

Gallery generated by Sphinx-Gallery

previous

Cartopy Favicon

next

Displaying all 60 zones of the UTM projection

Show Source

© Copyright 2011 - 2018 British Crown Copyright, 2018 - 2023 Cartopy contributors.

Created using Sphinx 7.1.2.

Built with the PyData Sphinx Theme 0.13.3.