import matplotlib.pyplot as plt
import cartopy.crs as ccrs
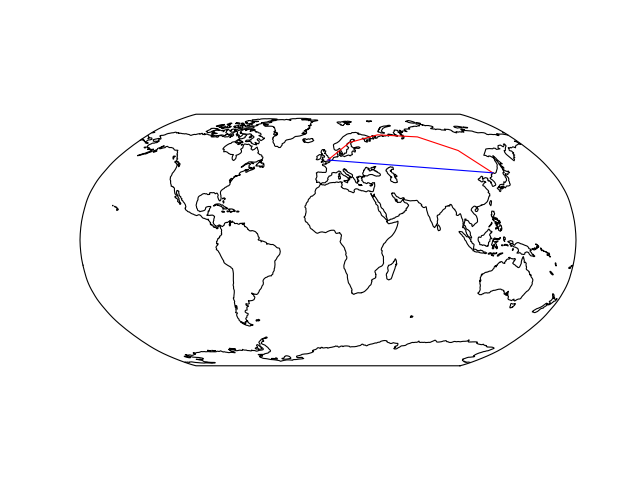
ax = plt.axes(projection=ccrs.Robinson())
ax.set_global()
ax.coastlines()
plt.plot([-0.08, 132], [51.53, 43.17], color='red', transform=ccrs.Geodetic())
plt.plot([-0.08, 132], [51.53, 43.17], color='blue', transform=ccrs.PlateCarree())
plt.show()
(Source code, png)
