import matplotlib.pyplot as plt
import matplotlib.patches as mpatches
import cartopy.crs as ccrs
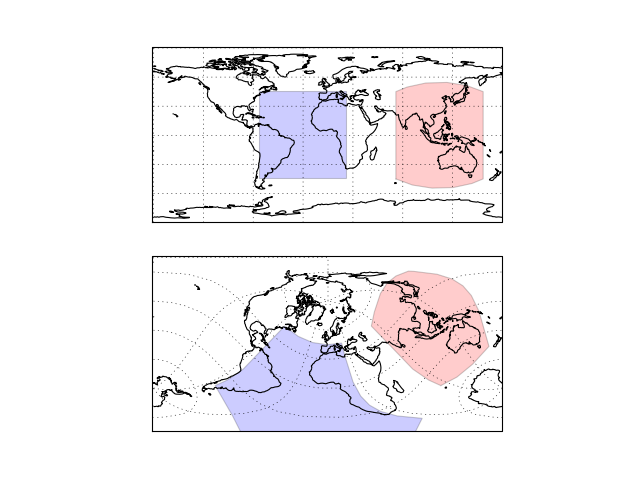
desired_projections = [ccrs.PlateCarree(),
ccrs.RotatedPole(pole_latitude=45, pole_longitude=180)]
for plot_num, desired_proj in enumerate(desired_projections):
ax = plt.subplot(2, 1, plot_num + 1, projection=desired_proj)
ax.set_global()
ax.add_patch(mpatches.Rectangle(xy=[-70, -45], width=90, height=90,
facecolor='blue',
alpha=0.2,
transform=ccrs.PlateCarree())
)
ax.add_patch(mpatches.Rectangle(xy=[70, -45], width=90, height=90,
facecolor='red',
alpha=0.2,
transform=ccrs.Geodetic())
)
ax.gridlines()
ax.coastlines()
plt.show()
(Source code, png)
