What’s new in cartopy 0.10
We are very pleased to announce that Andrew Dawson was added to the cartopy
core development team. In this release Andrew has single-handedly
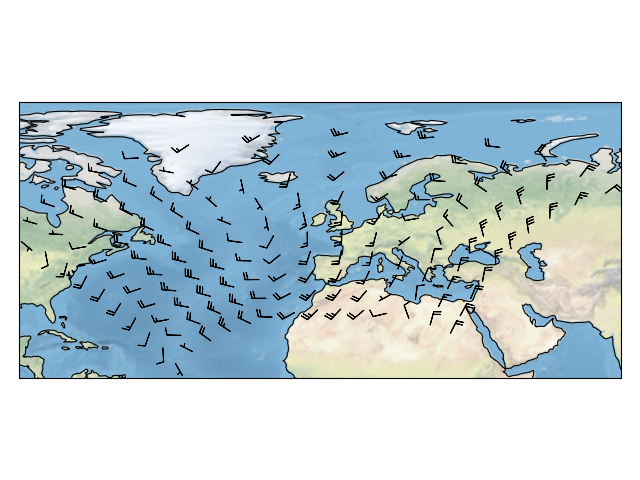
implemented comprehensive vector transformation and visualisation
capabilities, including:
- The ability to transform vector fields between different coordinate
reference systems via the transform_vectors()
CRS method.
- GeoAxes.quiver and
GeoAxes.barbs for arrow and
barb plotting. More information is available at Vector plotting.
- A regridding function for “regularising” a vector field in the target
coordinate system. See also
cartopy.vector_transform.vector_scalar_to_grid(). Both
quiver() and
barbs() accept the regrid_shape
keyword to trigger this behaviour automatically.
- GeoAxes.streamplot adds
the ability to draw streamlines in any projection from a vector field in
any other projection.
(Source code)
What’s new in cartopy 0.9
| Release: | 0.9.0 |
|---|
| Date: | 12 September 2013 |
|---|
We are very pleased to announce that Bill Little was added to the cartopy
core development team. Bill has made some excellent contributions to cartopy,
and his presentation at EuroScipy‘13 on
“Iris & Cartopy”
was voted best talk of the conference.
Other talks and tutorials during this release cycle include Phil Elson’s talk at SciPy‘13
(with video),
Thomas Lecocq’s tutorial at EuroSciPy
and a forthcoming talk at FOSS4G.
Christoph Gohlke updated cartopy to support Windows 7.
The Plate Carree projection was updated to fully handle arbitrary globe definitions.
Peter Killick updated the Mercator class’ default globe to WGS84. His refactor paved the way
for some follow on work to fully implement the Google Spherical Mercator (EPSG:3857) projection.
The TransverseMercator class saw a tidy up to include several common arguments (ticket)
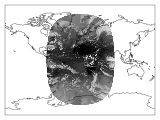
Bill Little added the Geostationary projection to allow geolocation of satellite imagery.
Byron Blay added the Lambert conformal conic projection.
What’s new in cartopy 0.8
| Release: | 0.8.0 |
|---|
| Date: | 3 June 2013 |
|---|
- Bill Little added support for the OSNI projection and enhanced the image nest capability. (PR #263)
- cartopy.io.img_nest.Img has been extended to include a
cartopy.io.img_nest.Img.from_world_file() static method for
easier loading of georeferenced images.
- Phil Elson added a major performance improvement when plotting data from PlateCarree onto a
PlateCarree map. (PR #260)
- Byron Blay and Richard Hattersley added a cartopy.crs.Globe class to encapsulate ellipsoid and optionally
datum information for CRSs. Globe handling in many projections, including Stereographic, has been added.
What’s new in cartopy 0.7
| Release: | 0.7.0 |
|---|
| Date: | 21 Mar 2013 |
|---|
This is a quick release which targets two very specific requirements. The goals outlined in the development plan at
v0.6 still remain the primary target for v0.8 and beyond.
What’s new in cartopy 0.6
| Release: | 0.6.0 |
|---|
| Date: | 19 Feb 2013 |
|---|
- Patrick Peglar added the ability to draw ticks for some limited projections
when using the gridlines() method on an Axes.
- Phil Elson and Carwyn Pelley extended the cartopy documentation to include
new tutorials such as Using the cartopy shapereader.
- Ian Edwards added a new example to create a favicon for cartopy.
- Phil Elson added a new example to show polygon analysis
and visualisation with Shapely and cartopy.
- Edward Campbell added a new cartopy.crs.EuroPP projection for UTM zone 32.
- Andrew Dawson added a central_longitude keyword for the Stereographic family of projections.
- Phil Elson added a Downloader class which allows
automatic downloading of shapefiles (currently from Natural Earth and GSHHS).
The extension requires no user action and can be configured via the cartopy.config dictionary.
Development plans for cartopy 0.7 and beyond
- Improve the projection definitions to support better control over datum definitions
and consider adding WKT support (ticket).
- Begin work on vector field support (barbs, quiver, streamlines etc.).
- Continue identifying and implementing performance enhancements (particularly in contour drawing).
- Extend the number of projections for which it is possible to draw tick marks.
What’s new in cartopy 0.5
| Release: | 0.5.0 |
|---|
| Date: | 7 Dec 2012 |
|---|
This document explains the new/changed features of cartopy in version 0.5.
Release 0.5 of cartopy continues the work to expand the feature-set of
cartopy to encompass common operations, and provide performance
improvements.
Cartopy 0.5 features
A summary of the main features added with version 0.5:
- An improved feature API to support future expansion and
sophistication, and a wider range of pre-defined Natural Earth
datasets.
Incompatible changes
None
Deprecations
- The method Axes.natural_earth_shp() has been replaced by the
method Axes.add_feature() and the cartopy.feature
module.
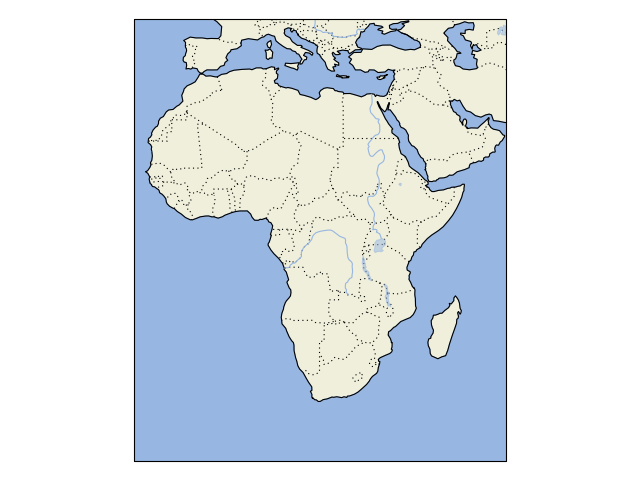
Feature API
A new features api is now available, see Using the cartopy shapereader.
import cartopy
import matplotlib.pyplot as plt


def main():

    ax = plt.axes(projection=cartopy.crs.PlateCarree())

    ax.add_feature(cartopy.feature.LAND)
    ax.add_feature(cartopy.feature.OCEAN)
    ax.add_feature(cartopy.feature.COASTLINE)
    ax.add_feature(cartopy.feature.BORDERS, linestyle=':')
    ax.add_feature(cartopy.feature.LAKES, alpha=0.5)
    ax.add_feature(cartopy.feature.RIVERS)

    ax.set_extent([-20, 60, -40, 40])

    plt.show()


if __name__ == '__main__':
    main()
(Source code)