Interactive WMS (Web Map Service)
This example demonstrates the interactive pan and zoom capability supported by an OGC web services Web Map Service (WMS) aware axes.
import cartopy.crs as ccrs
import matplotlib.pyplot as plt
def main():
fig = plt.figure(figsize=(10, 5))
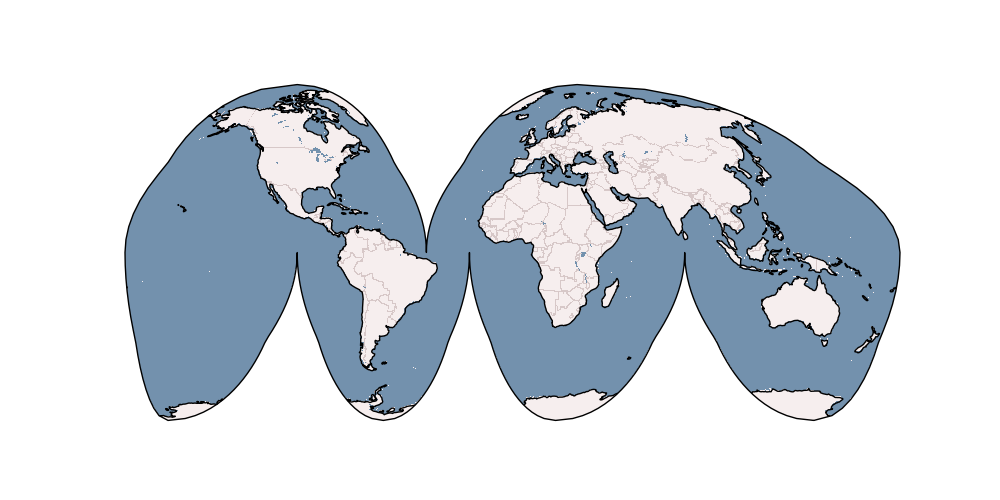
ax = fig.add_subplot(1, 1, 1, projection=ccrs.InterruptedGoodeHomolosine())
ax.coastlines()
ax.add_wms(wms='http://vmap0.tiles.osgeo.org/wms/vmap0',
layers=['basic'])
plt.show()
if __name__ == '__main__':
main()
Total running time of the script: ( 0 minutes 1.215 seconds)