Note
Click here to download the full example code
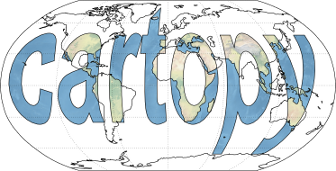
Cartopy Logo
The actual code to produce cartopy’s logo.
import cartopy.crs as ccrs
import matplotlib.pyplot as plt
import matplotlib.textpath
import matplotlib.patches
from matplotlib.font_manager import FontProperties
import numpy as np


def main():
    fig = plt.figure(figsize=[12, 6])
    ax = fig.add_subplot(1, 1, 1, projection=ccrs.Robinson())

    ax.coastlines()
    ax.gridlines()

    # generate a matplotlib path representing the word "cartopy"
    fp = FontProperties(family='Bitstream Vera Sans', weight='bold')
    logo_path = matplotlib.textpath.TextPath((-175, -35), 'cartopy',
                                             size=1, prop=fp)
    # scale the letters up to sensible longitude and latitude sizes
    logo_path._vertices *= np.array([80, 160])

    # add a background image
    im = ax.stock_img()
    # clip the image according to the logo_path. mpl v1.2.0 does not support
    # the transform API that cartopy makes use of, so we have to convert the
    # projection into a transform manually
    plate_carree_transform = ccrs.PlateCarree()._as_mpl_transform(ax)
    im.set_clip_path(logo_path, transform=plate_carree_transform)

    # add the path as a patch, drawing black outlines around the text
    patch = matplotlib.patches.PathPatch(logo_path,
                                         facecolor='none', edgecolor='black',
                                         transform=ccrs.PlateCarree())
    ax.add_patch(patch)

    plt.show()


if __name__ == '__main__':
    main()
Total running time of the script: ( 0 minutes 2.821 seconds)