Miscellaneous cartopy utilities
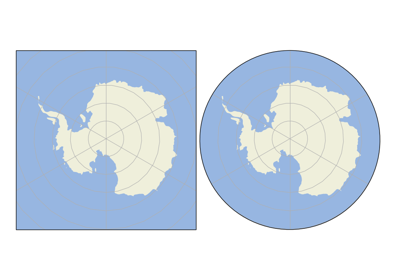
Custom Boundary Shape
The following visual examples demonstrate some of the functionality of Cartopy, particularly its matplotlib interface.
For a structured introduction to cartopy, including some of these examples, see Getting started.
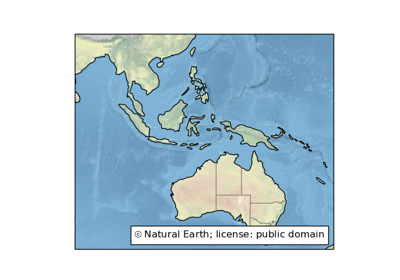
Feature Creation
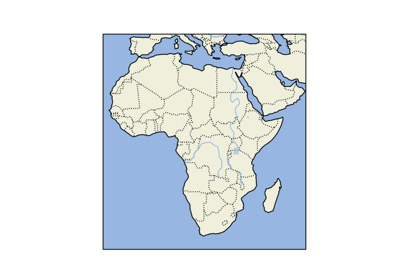
Features
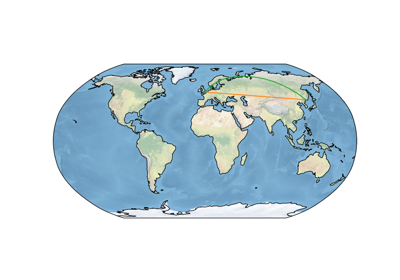
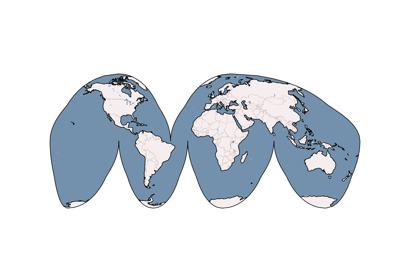
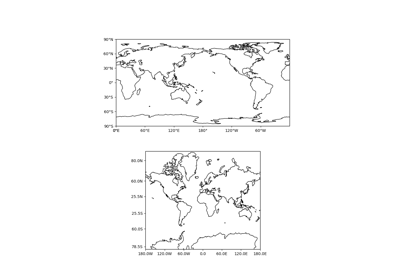
Global Map
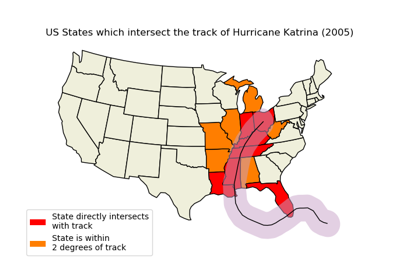
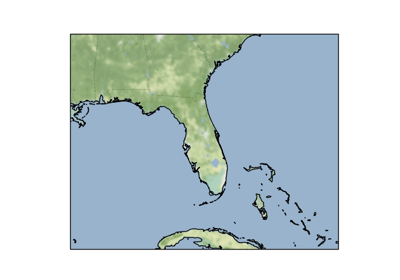
Hurricane Katrina
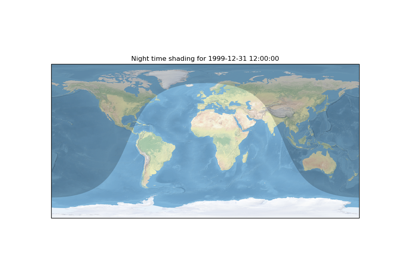
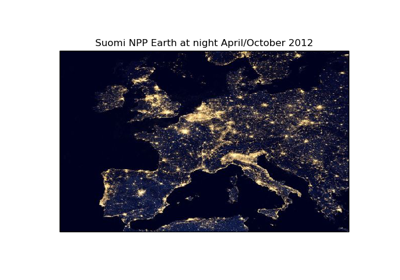
Nightshade feature
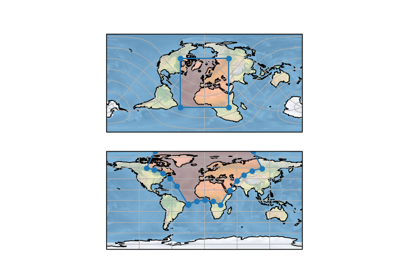
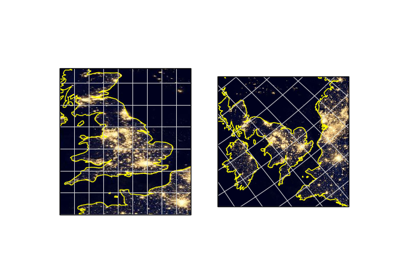
Rotated pole boxes
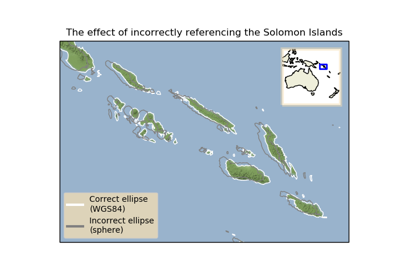
The effect of badly referencing an ellipse
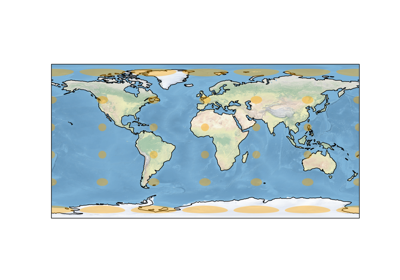
Tissot’s Indicatrix
Filled contours
Map tile acquisition
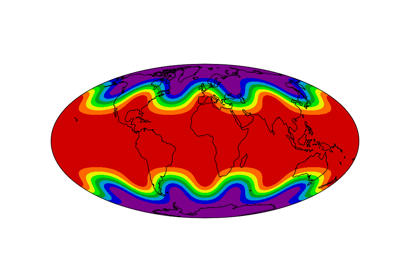
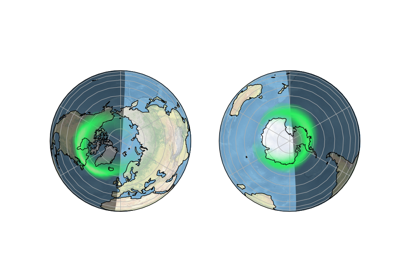
Plotting the Aurora Forecast from NOAA on Orthographic Polar Projection
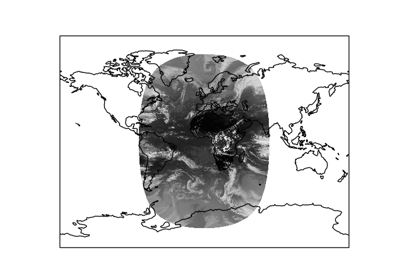
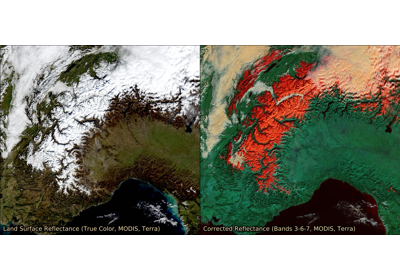
Reprojecting images from a Geostationary projection
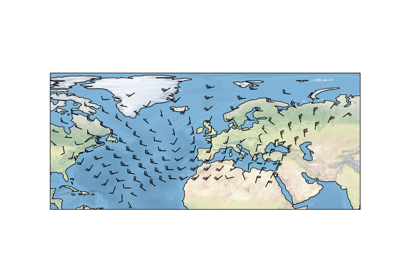
Arrows
Barbs
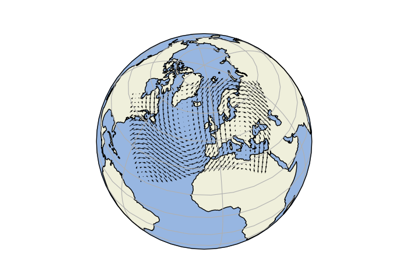
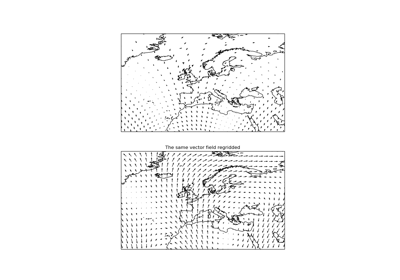
Regridding vectors with quiver
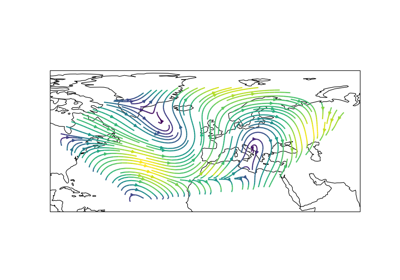
Streamplot
Displaying WMTS tiled map data on an arbitrary projection
Interactive WMS (Web Map Service)
Interactive WMTS (Web Map Tile Service)
Web Map Tile Service time dimension demonstration
Web tile imagery
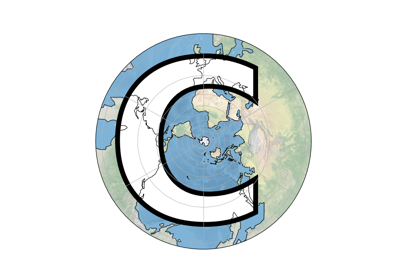
Cartopy Favicon
Cartopy Logo
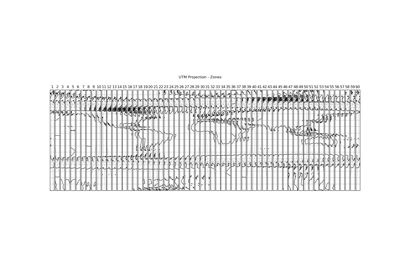
Displaying all 60 zones of the UTM projection
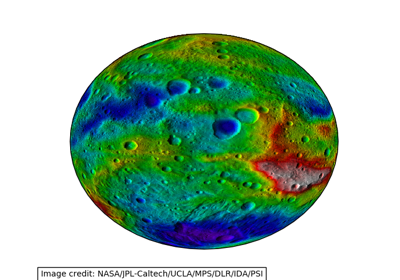
Displaying data on an eccentric ellipse
Modifying the boundary/neatline of a map in cartopy
Tick Labels
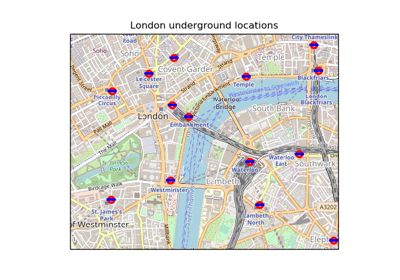
Tube Stations
UN Flag
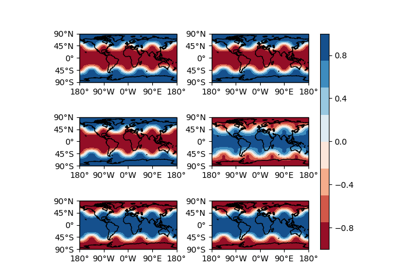
Using Cartopy and AxesGrid toolkit
Gallery generated by Sphinx-Gallery