Note
Click here to download the full example code
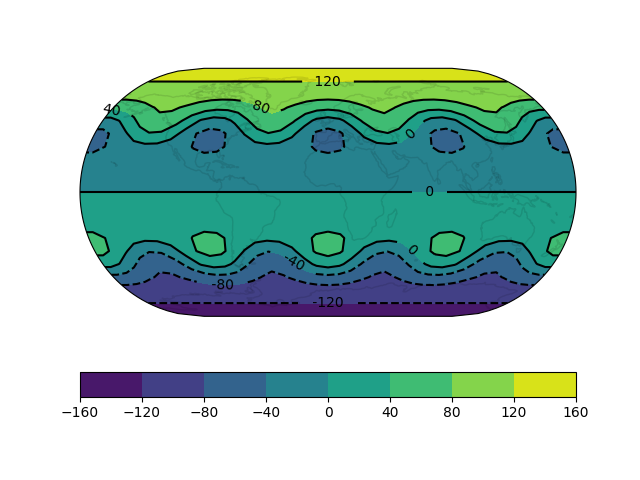
Contour labels
An example of adding contour labels to matplotlib contours.
import cartopy.crs as ccrs
import matplotlib.pyplot as plt

from cartopy.examples.waves import sample_data


def main():
    fig = plt.figure()

    # Setup a global EckertIII map with faint coastlines.
    ax = fig.add_subplot(1, 1, 1, projection=ccrs.EckertIII())
    ax.set_global()
    ax.coastlines('110m', alpha=0.1)

    # Use the waves example to provide some sample data, but make it
    # more dependent on y for more interesting contours.
    x, y, z = sample_data((20, 40))
    z = z * -1.5 * y

    # Add colourful filled contours.
    filled_c = ax.contourf(x, y, z, transform=ccrs.PlateCarree())

    # And black line contours.
    line_c = ax.contour(x, y, z, levels=filled_c.levels,
                        colors=['black'],
                        transform=ccrs.PlateCarree())

    # Uncomment to make the line contours invisible.
    # plt.setp(line_c.collections, visible=False)

    # Add a colorbar for the filled contour.
    fig.colorbar(filled_c, orientation='horizontal')

    # Use the line contours to place contour labels.
    ax.clabel(
        line_c,  # Typically best results when labelling line contours.
        colors=['black'],
        manual=False,  # Automatic placement vs manual placement.
        inline=True,  # Cut the line where the label will be placed.
        fmt=' {:.0f} '.format,  # Labes as integers, with some extra space.
    )

    plt.show()


if __name__ == '__main__':
    main()
Total running time of the script: ( 0 minutes 0.192 seconds)