Cartopy map gridlines and tick labels
The Gridliner instance, often created by calling the
cartopy.mpl.geoaxes.GeoAxes.gridlines() method on a
cartopy.mpl.geoaxes.GeoAxes instance, has a variety of attributes which can be
used to determine draw time behaviour of the gridlines and labels.
Important
The current Gridliner interface is likely to undergo
a significant change in the versions following v0.6 in order to fix some of the underying
limitations of the current implementation.
-
class
cartopy.mpl.gridliner.Gridliner(axes, crs, draw_labels=False, xlocator=None, ylocator=None, collection_kwargs=None, xformatter=None, yformatter=None, dms=False, x_inline=None, y_inline=None, auto_inline=True)[source]¶ Object used by
cartopy.mpl.geoaxes.GeoAxes.gridlines()to add gridlines and tick labels to a map.- Parameters
axes – The
cartopy.mpl.geoaxes.GeoAxesobject to be drawn on.crs – The
cartopy.crs.CRSdefining the coordinate system that the gridlines are drawn in.draw_labels (optional) – Toggle whether to draw labels. For finer control, attributes of
Gridlinermay be modified individually. Defaults to False.xlocator (optional) – A
matplotlib.ticker.Locatorinstance which will be used to determine the locations of the gridlines in the x-coordinate of the given CRS. Defaults to None, which implies automatic locating of the gridlines.ylocator (optional) – A
matplotlib.ticker.Locatorinstance which will be used to determine the locations of the gridlines in the y-coordinate of the given CRS. Defaults to None, which implies automatic locating of the gridlines.xformatter (optional) – A
matplotlib.ticker.Formatterinstance to format labels for x-coordinate gridlines. It defaults to None, which implies the use of acartopy.mpl.ticker.LongitudeFormatterinitiated with thedmsargument, if the crs is ofPlateCarreetype.yformatter (optional) – A
matplotlib.ticker.Formatterinstance to format labels for y-coordinate gridlines. It defaults to None, which implies the use of acartopy.mpl.ticker.LatitudeFormatterinitiated with thedmsargument, if the crs is ofPlateCarreetype.collection_kwargs (optional) – Dictionary controlling line properties, passed to
matplotlib.collections.Collection. Defaults to None.dms (bool) – When default locators and formatters are used, ticks are able to stop on minutes and seconds if minutes is set to True, and not fraction of degrees.
x_inline (optional) – Toggle whether the x labels drawn should be inline.
y_inline (optional) – Toggle whether the y labels drawn should be inline.
auto_inline (optional) – Set x_inline and y_inline automatically based on projection.
Notes
The “x” and “y” labels for locators and formatters do not necessarily correspond to X and Y, but to the first and second coordinates of the specified CRS. For the common case of PlateCarree gridlines, these correspond to longitudes and latitudes. Depending on the projection used for the map, meridians and parallels can cross both the X axis and the Y axis.
-
bottom_labels= None¶ Whether to draw labels on the bottom of the map.
-
collection_kwargs= None¶ A dictionary passed through to
matplotlib.collections.LineCollectionon grid line creation.
-
label_artists
-
left_labels= None¶ Whether to draw labels on the left hand side of the map.
-
n_steps= None¶ The number of interpolation points which are used to draw the gridlines.
-
right_labels= None¶ Whether to draw labels on the right hand side of the map.
-
rotate_labels= None¶ Allow the rotation of labels.
-
top_labels= None¶ Whether to draw labels on the top of the map.
-
x_inline= None¶ Whether to draw x labels inline
-
xlabel_style= None¶ A dictionary passed through to
ax.texton x label creation for styling of the text labels.
-
xlabels_bottom
-
xlabels_top
-
xline_artists= None¶ The x gridlines which were created at draw time.
-
xlines= None¶ Whether to draw the x gridlines.
-
xpadding= None¶ The padding from the map edge to the x labels in points.
-
y_inline= None¶ Whether to draw y labels inline
-
ylabel_style= None¶ A dictionary passed through to
ax.texton y label creation for styling of the text labels.
-
ylabels_left
-
ylabels_right
-
yline_artists= None¶ The y gridlines which were created at draw time.
-
ylines= None¶ Whether to draw the y gridlines.
-
ypadding= None¶ The padding from the map edge to the y labels in points.
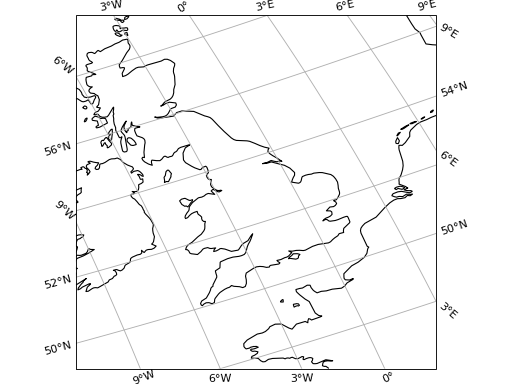
In this first example, gridines and tick labels are plotted in a non-rectangular projection, with most default values and no tuning of the gridliner attributes:
import matplotlib.pyplot as plt
import cartopy.crs as ccrs

rotated_crs = ccrs.RotatedPole(pole_longitude=120.0, pole_latitude=70.0)

ax = plt.axes(projection=rotated_crs)
ax.set_extent([-6, 3, 48, 58], crs=ccrs.PlateCarree())
ax.coastlines(resolution='50m')
ax.gridlines(draw_labels=True, dms=True, x_inline=False, y_inline=False)

plt.show()
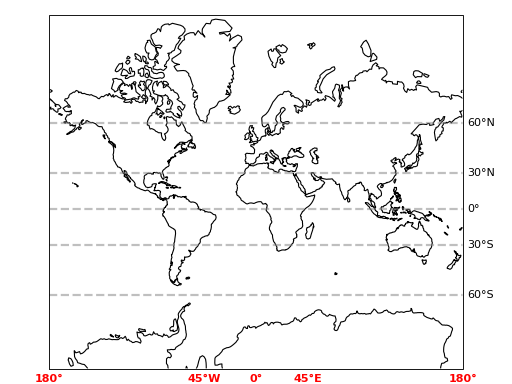
The following contrived example makes use of many of the features of the Gridliner class to produce customized gridlines and tick labels:
import matplotlib.pyplot as plt
import matplotlib.ticker as mticker
import cartopy.crs as ccrs

from cartopy.mpl.ticker import (LongitudeFormatter, LatitudeFormatter,
                                LatitudeLocator)


ax = plt.axes(projection=ccrs.Mercator())
ax.coastlines()

gl = ax.gridlines(crs=ccrs.PlateCarree(), draw_labels=True,
                  linewidth=2, color='gray', alpha=0.5, linestyle='--')
gl.top_labels = False
gl.left_labels = False
gl.xlines = False
gl.xlocator = mticker.FixedLocator([-180, -45, 0, 45, 180])
gl.ylocator = LatitudeLocator()
gl.xformatter = LongitudeFormatter()
gl.yformatter = LatitudeFormatter()
gl.xlabel_style = {'size': 15, 'color': 'gray'}
gl.xlabel_style = {'color': 'red', 'weight': 'bold'}

plt.show()