The following examples show off the functionality of Cartopy. They illustrate the kinds of things you can do with this library. For more examples, tutorials, and guides on how to use Cartopy, see the getting started section.
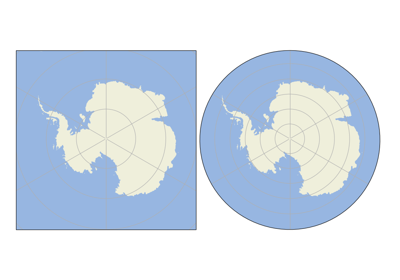
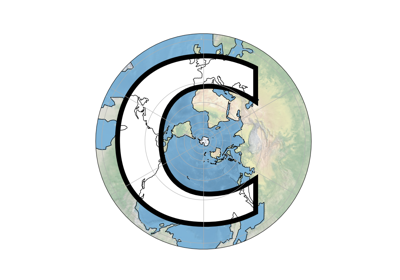
Custom Boundary Shape
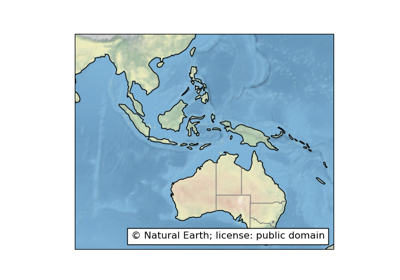
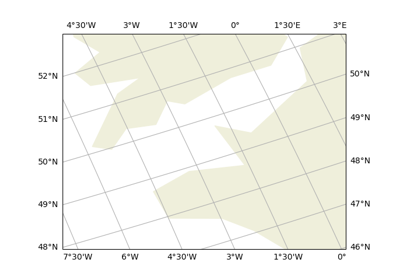
Feature Creation
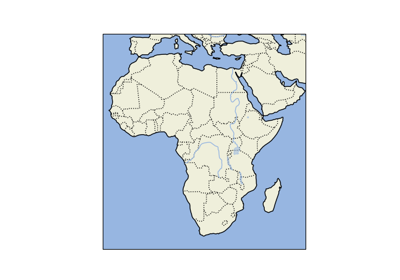
Features
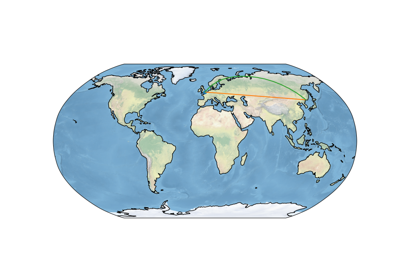
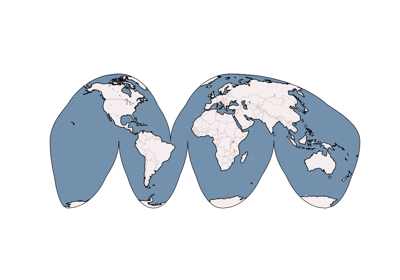
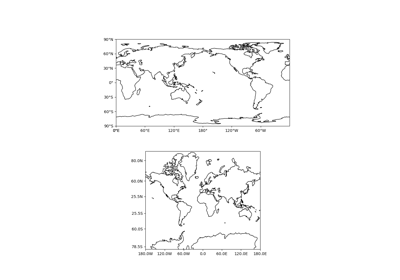
Global Map
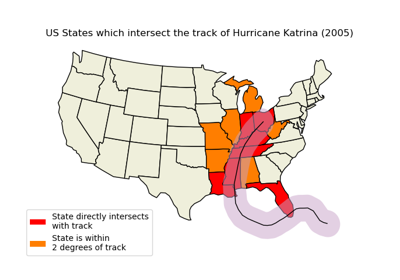
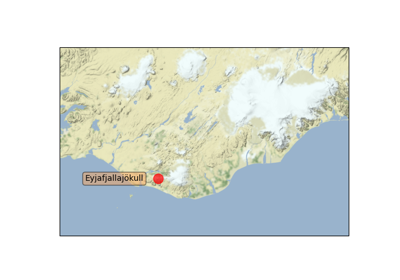
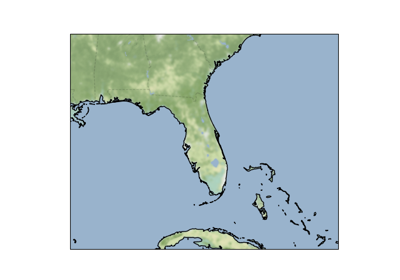
Hurricane Katrina
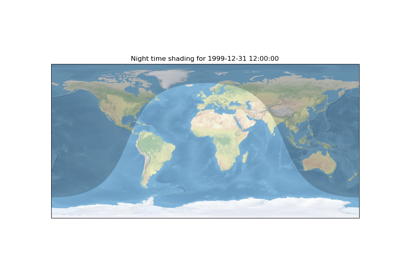
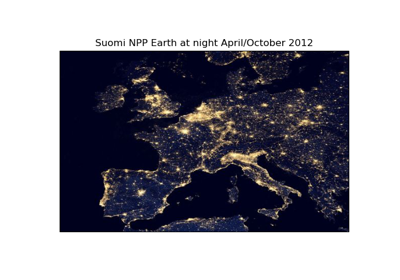
Nightshade feature
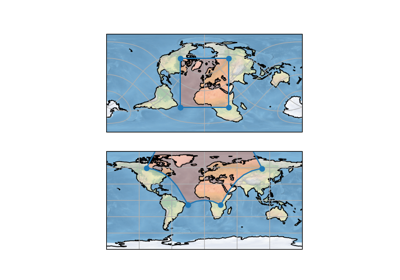
Rotated pole boxes
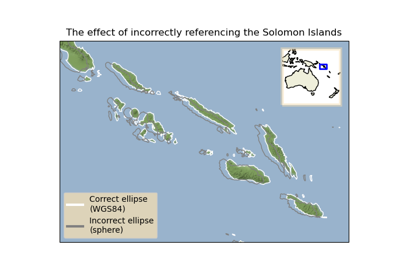
The effect of badly referencing an ellipse
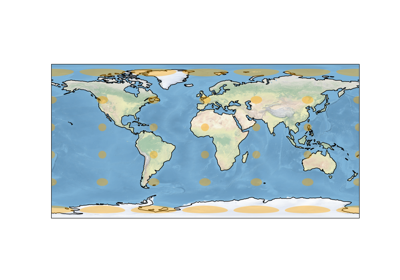
Tissot’s Indicatrix
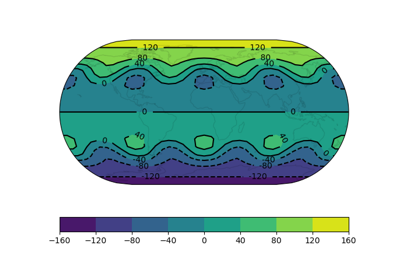
Contour labels
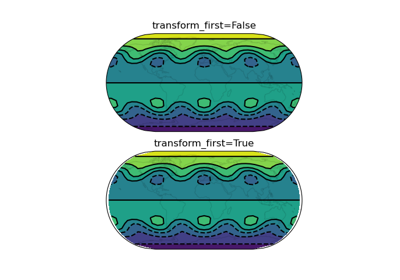
Contour transform options
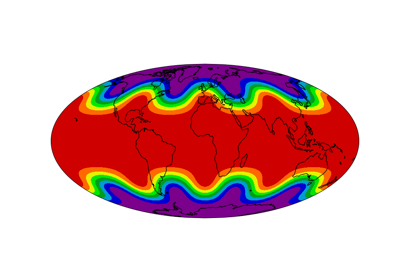
Filled contours
Map tile acquisition
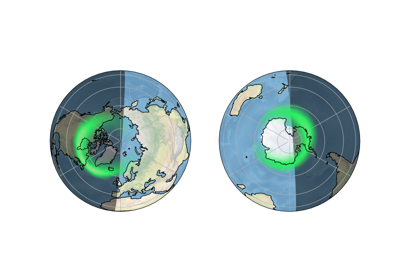
Plotting the Aurora Forecast from NOAA on Orthographic Polar Projection
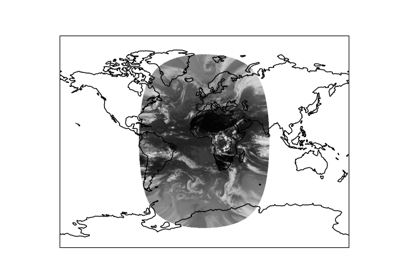
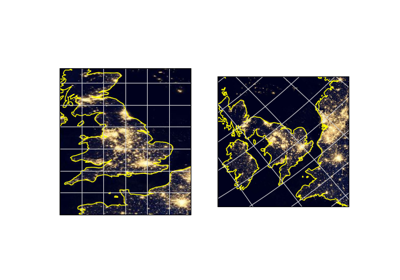
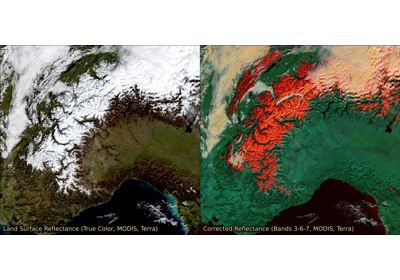
Reprojecting images from a Geostationary projection
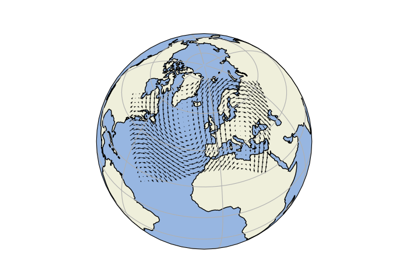
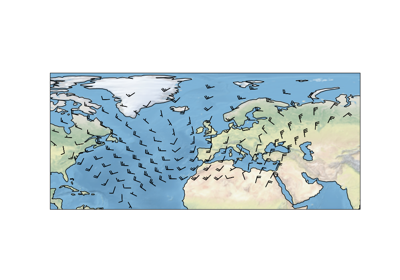
Arrows
Barbs
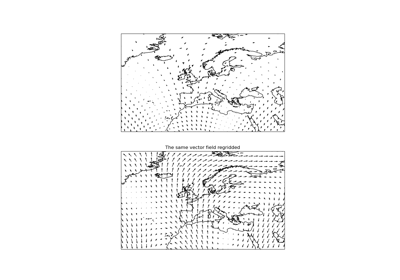
Regridding vectors with quiver
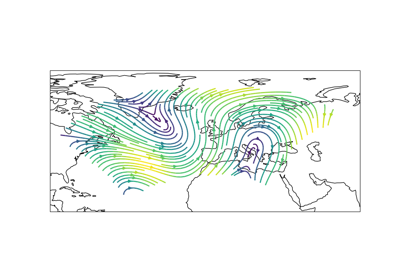
Streamplot
Displaying WMTS tiled map data on an arbitrary projection
Interactive WMS (Web Map Service)
Interactive WMTS (Web Map Tile Service)
Web Map Tile Service time dimension demonstration
Web tile imagery
Gridlines and tick labels
Tick Labels
Animating a gridded surface
Cartopy Favicon
Cartopy Logo
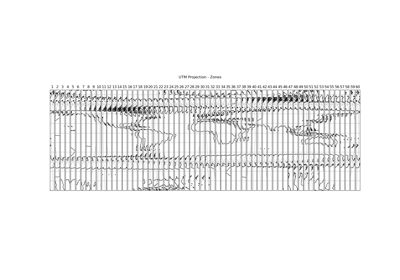
Displaying all 60 zones of the UTM projection
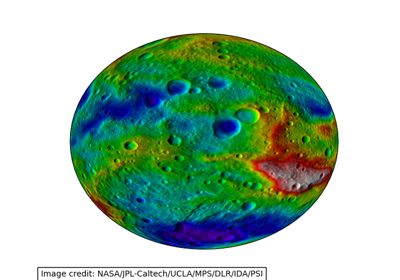
Displaying data on an eccentric ellipse
Modifying the boundary/neatline of a map in cartopy
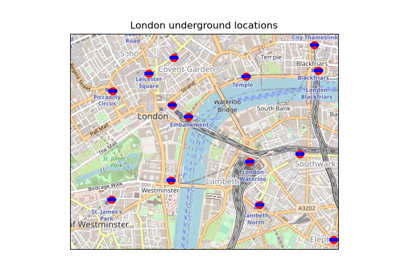
Tube Stations
UN Flag
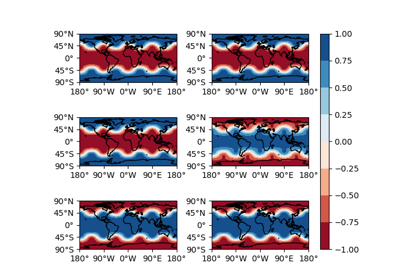
Using Cartopy and AxesGrid toolkit
Gallery generated by Sphinx-Gallery