logo
  • Getting started
  • Gallery
  • Installation
  • API reference
  • What’s new
  • Custom Boundary Shape
  • Feature Creation
  • Features
  • Global Map
  • Hurricane Katrina
  • Nightshade feature
  • Rotated pole boxes
  • The effect of badly referencing an ellipse
  • Tissot’s Indicatrix
  • Contour labels
  • Contour transform options
  • Filled contours
  • Map tile acquisition
  • Plotting the Aurora Forecast from NOAA on Orthographic Polar Projection
  • Reprojecting images from a Geostationary projection
  • Arrows
  • Barbs
  • Regridding vectors with quiver
  • Streamplot
  • Displaying WMTS tiled map data on an arbitrary projection
  • Interactive WMS (Web Map Service)
  • Interactive WMTS (Web Map Tile Service)
  • Web Map Tile Service time dimension demonstration
  • Web tile imagery
  • Gridlines and tick labels
  • Tick Labels
  • Animating a gridded surface
  • Cartopy Favicon
  • Cartopy Logo
  • Displaying all 60 zones of the UTM projection
  • Displaying data on an eccentric ellipse
  • Modifying the boundary/neatline of a map in cartopy
  • Tube Stations
  • UN Flag
  • Using Cartopy and AxesGrid toolkit

Note

Click here to download the full example code

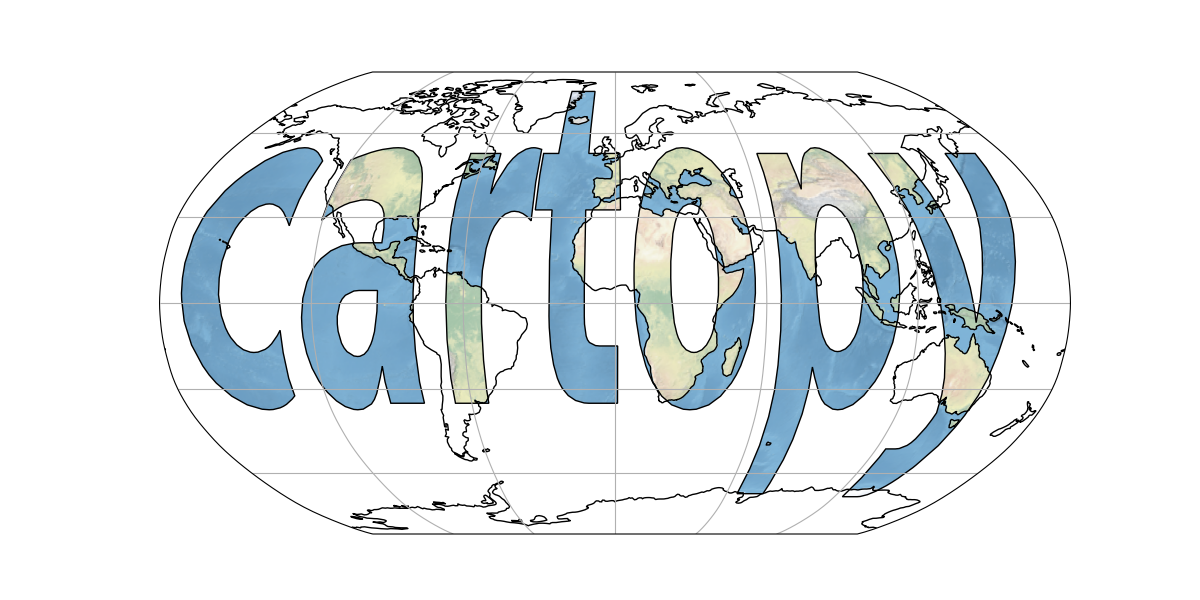
Cartopy Logo

The actual code to produce cartopy’s logo.
logo
import cartopy.crs as ccrs
import matplotlib.pyplot as plt
import matplotlib.textpath
import matplotlib.patches
import matplotlib.transforms
from matplotlib.font_manager import FontProperties


def main():
    fig = plt.figure(figsize=[12, 6])
    ax = fig.add_subplot(1, 1, 1, projection=ccrs.Robinson())

    ax.coastlines()
    ax.gridlines()

    # generate a matplotlib path representing the word "cartopy"
    fp = FontProperties(family='DejaVu Sans', weight='bold')
    logo_path = matplotlib.textpath.TextPath((-175, -35), 'cartopy',
                                             size=80, prop=fp)
    # scale the letters up to sensible longitude and latitude sizes
    transform = matplotlib.transforms.Affine2D().scale(1, 2).translate(0, 35)

    # add a background image
    im = ax.stock_img()
    # Apply the scale transform and then the map coordinate transform
    plate_carree_transform = (transform +
                              ccrs.PlateCarree()._as_mpl_transform(ax))

    # add the path as a patch, drawing black outlines around the text
    patch = matplotlib.patches.PathPatch(logo_path,
                                         facecolor='none', edgecolor='black',
                                         transform=plate_carree_transform)
    im.set_clip_path(patch)
    ax.add_patch(patch)

    plt.show()


if __name__ == '__main__':
    main()

Total running time of the script: ( 0 minutes 2.003 seconds)

Download Python source code: logo.py

Download Jupyter notebook: logo.ipynb

Gallery generated by Sphinx-Gallery

Cartopy Favicon Displaying all 60 zones of the UTM projection

© Copyright 2011 - 2018 British Crown Copyright, 2018 - 2021 Cartopy contributors.

Created using Sphinx 4.2.0.