
Note
Go to the end to download the full example code.
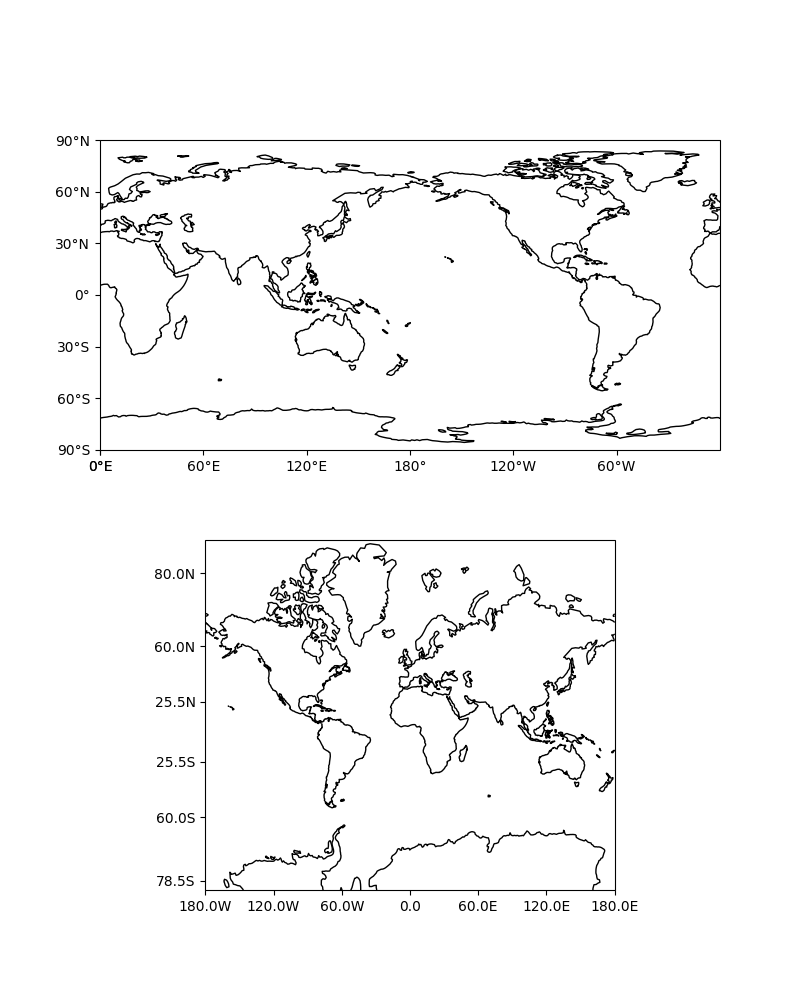
Tick Labels#
This example demonstrates adding tick labels to maps on rectangular projections using special tick formatters.
import matplotlib.pyplot as plt

import cartopy.crs as ccrs
from cartopy.mpl.ticker import LatitudeFormatter, LongitudeFormatter


def main():
    fig = plt.figure(figsize=(8, 10))

    # Label axes of a Plate Carree projection with a central longitude of 180:
    ax1 = fig.add_subplot(2, 1, 1,
                          projection=ccrs.PlateCarree(central_longitude=180))
    ax1.set_global()
    ax1.coastlines()
    ax1.set_xticks([0, 60, 120, 180, 240, 300, 360], crs=ccrs.PlateCarree())
    ax1.set_yticks([-90, -60, -30, 0, 30, 60, 90], crs=ccrs.PlateCarree())
    lon_formatter = LongitudeFormatter(zero_direction_label=True)
    lat_formatter = LatitudeFormatter()
    ax1.xaxis.set_major_formatter(lon_formatter)
    ax1.yaxis.set_major_formatter(lat_formatter)

    # Label axes of a Mercator projection without degree symbols in the labels
    # and formatting labels to include 1 decimal place:
    ax2 = fig.add_subplot(2, 1, 2, projection=ccrs.Mercator())
    ax2.set_global()
    ax2.coastlines()
    ax2.set_xticks([-180, -120, -60, 0, 60, 120, 180], crs=ccrs.PlateCarree())
    ax2.set_yticks([-78.5, -60, -25.5, 25.5, 60, 80], crs=ccrs.PlateCarree())
    lon_formatter = LongitudeFormatter(number_format='.1f',
                                       degree_symbol='',
                                       dateline_direction_label=True)
    lat_formatter = LatitudeFormatter(number_format='.1f',
                                      degree_symbol='')
    ax2.xaxis.set_major_formatter(lon_formatter)
    ax2.yaxis.set_major_formatter(lat_formatter)

    plt.show()


if __name__ == '__main__':
    main()
Total running time of the script: (0 minutes 0.412 seconds)