
Note
Go to the end to download the full example code.
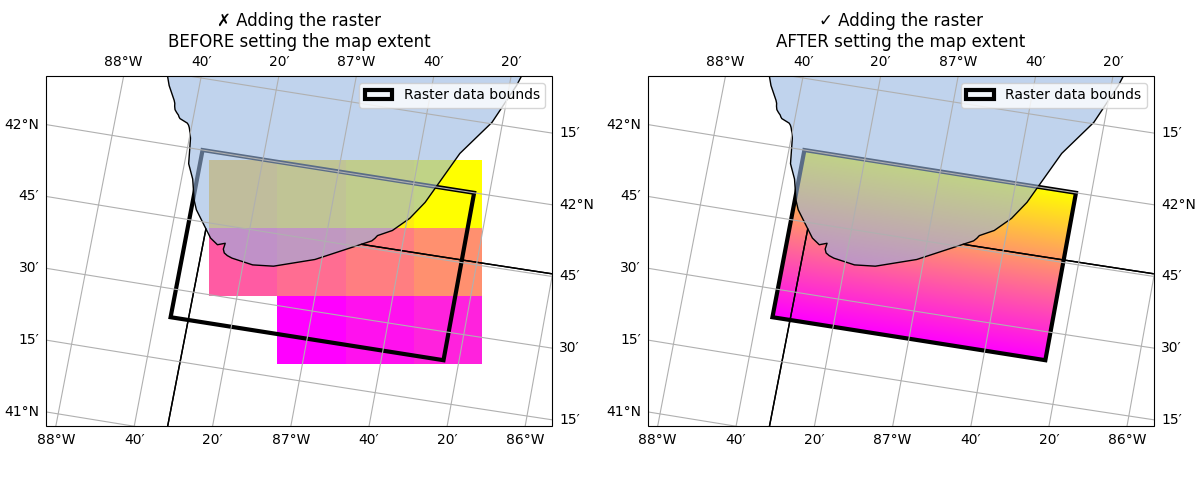
Raster reprojections#
When plotting raster data onto a map with imshow, we need to first set the
extent of the map so the reprojection is done correctly.
In this example, we have some raster data stored as a numpy array that is
referenced to a rectangular coordinate system (PlateCarree). Cartopy reprojects the
data to match the map’s coordinate system based on the currently set map limits.
This means that the map extent/boundary must be set before imshow is called.
from matplotlib.patches import Rectangle
import matplotlib.pyplot as plt
import numpy as np

import cartopy.crs as ccrs
import cartopy.feature as cf


def main():
    # Generate raster data as a numpy array
    img = np.linspace(0, 1, 10_000).reshape(100, 100)

    # Define the origin and extent of the image following matplotlib's
    # convention `(left, right, bottom, top)`. These are referenced to
    # a rectangular coordinate system.
    img_origin = "lower"
    img_extent = (-87.6, -86.4, 41.4, 42.0)
    img_proj = ccrs.PlateCarree()

    imshow_kwargs = dict(
        extent=img_extent,
        origin=img_origin,
        transform=img_proj,
        cmap="spring",
    )

    # Define extent and projection for the map
    map_extent = (-88.1, -86.1, 41.2, 42.2)
    map_proj = ccrs.RotatedPole(pole_longitude=120.0, pole_latitude=70.0)

    fig, axs = plt.subplots(
        nrows=1,
        ncols=2,
        figsize=(12, 5),
        subplot_kw={"projection": map_proj},
        sharex=True,
        sharey=True,
        layout="constrained",
    )

    # Adding the raster *before* setting the map extent
    ax = axs[0]
    ax.set_title("\u2717 Adding the raster\nBEFORE setting the map extent")

    ax.imshow(img, **imshow_kwargs)
    ax.set_extent(map_extent, crs=img_proj)

    # Adding the raster *after* setting the map extent
    ax = axs[1]
    ax.set_title("\u2713 Adding the raster\nAFTER setting the map extent")

    ax.set_extent(map_extent, crs=img_proj)
    ax.imshow(img, **imshow_kwargs)

    for ax in axs:
        # Add other map features
        ax.add_feature(cf.LAKES, alpha=0.6)
        ax.add_feature(cf.STATES)

        # Highlight raster boundaries
        xy = (img_extent[0], img_extent[2])
        width = img_extent[1] - img_extent[0]
        height = img_extent[3] - img_extent[2]
        ax.add_patch(
            Rectangle(
                xy,
                width,
                height,
                transform=img_proj,
                edgecolor="black",
                facecolor="None",
                linewidth=3,
                label="Raster data bounds",
            )
        )

        ax.legend()
        ax.gridlines(draw_labels=True, x_inline=False, dms=True)

    plt.show()


if __name__ == "__main__":
    main()
Total running time of the script: (0 minutes 12.809 seconds)