
Note
Go to the end to download the full example code.
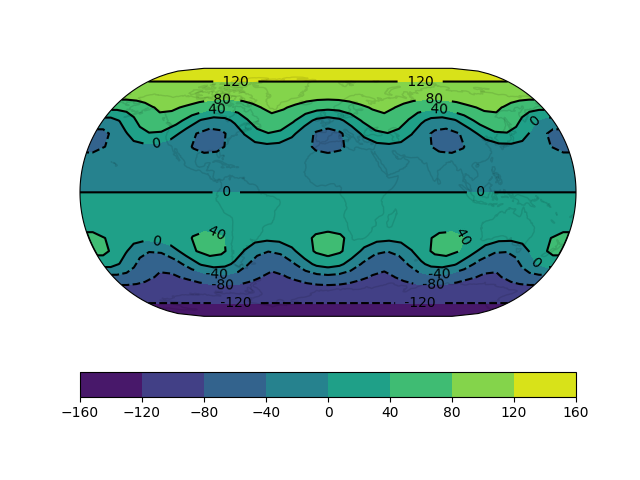
Contour labels#
An example of adding contour labels to matplotlib contours.
import matplotlib.pyplot as plt

import cartopy.crs as ccrs


def sample_data(shape=(73, 145)):
    """Return ``lons``, ``lats`` and ``data`` of some fake data."""
    import numpy as np

    nlats, nlons = shape
    lats = np.linspace(-np.pi / 2, np.pi / 2, nlats)
    lons = np.linspace(0, 2 * np.pi, nlons)
    lons, lats = np.meshgrid(lons, lats)
    wave = 0.75 * (np.sin(2 * lats) ** 8) * np.cos(4 * lons)
    mean = 0.5 * np.cos(2 * lats) * ((np.sin(2 * lats)) ** 2 + 2)

    lats = np.rad2deg(lats)
    lons = np.rad2deg(lons)
    data = wave + mean

    return lons, lats, data


def main():
    fig = plt.figure()

    # Setup a global EckertIII map with faint coastlines.
    ax = fig.add_subplot(1, 1, 1, projection=ccrs.EckertIII())
    ax.set_global()
    ax.coastlines('110m', alpha=0.1)

    # Use the same sample data as the waves example, but make it
    # more dependent on y for more interesting contours.
    x, y, z = sample_data((20, 40))
    z = z * -1.5 * y

    # Add colourful filled contours.
    filled_c = ax.contourf(x, y, z, transform=ccrs.PlateCarree())

    # And black line contours (or set colors='none' for invisible lines).
    line_c = ax.contour(x, y, z, levels=filled_c.levels,
                        colors='black',
                        transform=ccrs.PlateCarree())

    # Add a colorbar for the filled contour.
    fig.colorbar(filled_c, orientation='horizontal')

    # Use the line contours to place contour labels.
    ax.clabel(
        line_c,  # Typically best results when labelling line contours.
        colors=['black'],
        manual=False,  # Automatic placement vs manual placement.
        inline=True,  # Cut the line where the label will be placed.
        fmt=' {:.0f} '.format,  # Labes as integers, with some extra space.
    )

    plt.show()


if __name__ == '__main__':
    main()
Total running time of the script: (0 minutes 0.492 seconds)