
Note
Go to the end to download the full example code.
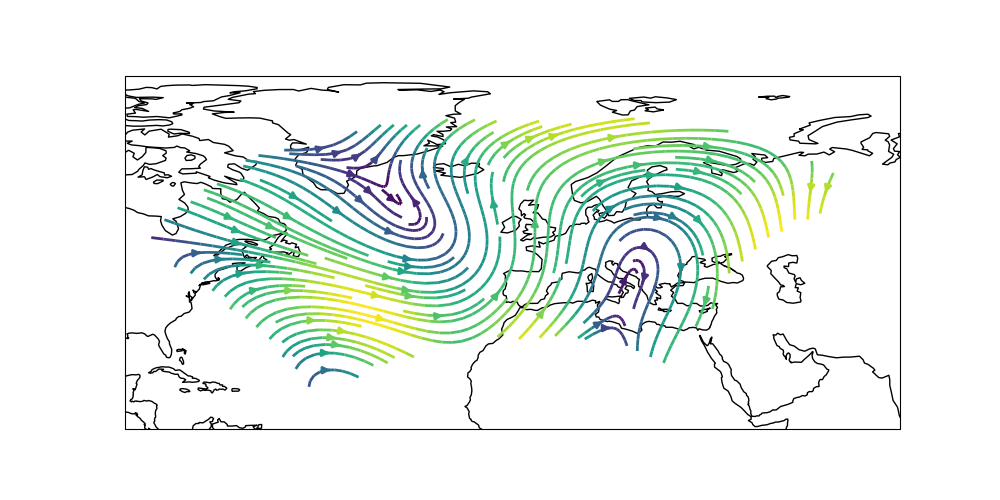
Streamplot#
Generating a vector-based streamplot.
import matplotlib.pyplot as plt
import numpy as np

import cartopy.crs as ccrs


def sample_data(shape=(20, 30)):
    """
    Return ``(x, y, u, v, crs)`` of some vector data
    computed mathematically. The returned crs will be a rotated
    pole CRS, meaning that the vectors will be unevenly spaced in
    regular PlateCarree space.

    """
    crs = ccrs.RotatedPole(pole_longitude=177.5, pole_latitude=37.5)

    x = np.linspace(311.9, 391.1, shape[1])
    y = np.linspace(-23.6, 24.8, shape[0])

    x2d, y2d = np.meshgrid(x, y)
    u = 10 * (2 * np.cos(2 * np.deg2rad(x2d) + 3 * np.deg2rad(y2d + 30)) ** 2)
    v = 20 * np.cos(6 * np.deg2rad(x2d))

    return x, y, u, v, crs


def main():
    fig = plt.figure(figsize=(10, 5))
    ax = fig.add_subplot(1, 1, 1, projection=ccrs.PlateCarree())
    ax.set_extent([-90, 75, 10, 85], crs=ccrs.PlateCarree())
    ax.coastlines()

    x, y, u, v, vector_crs = sample_data(shape=(80, 100))
    magnitude = np.hypot(u, v)
    ax.streamplot(x, y, u, v, transform=vector_crs,
                  linewidth=2, density=2, color=magnitude)
    plt.show()


if __name__ == '__main__':
    main()
Total running time of the script: (0 minutes 1.432 seconds)